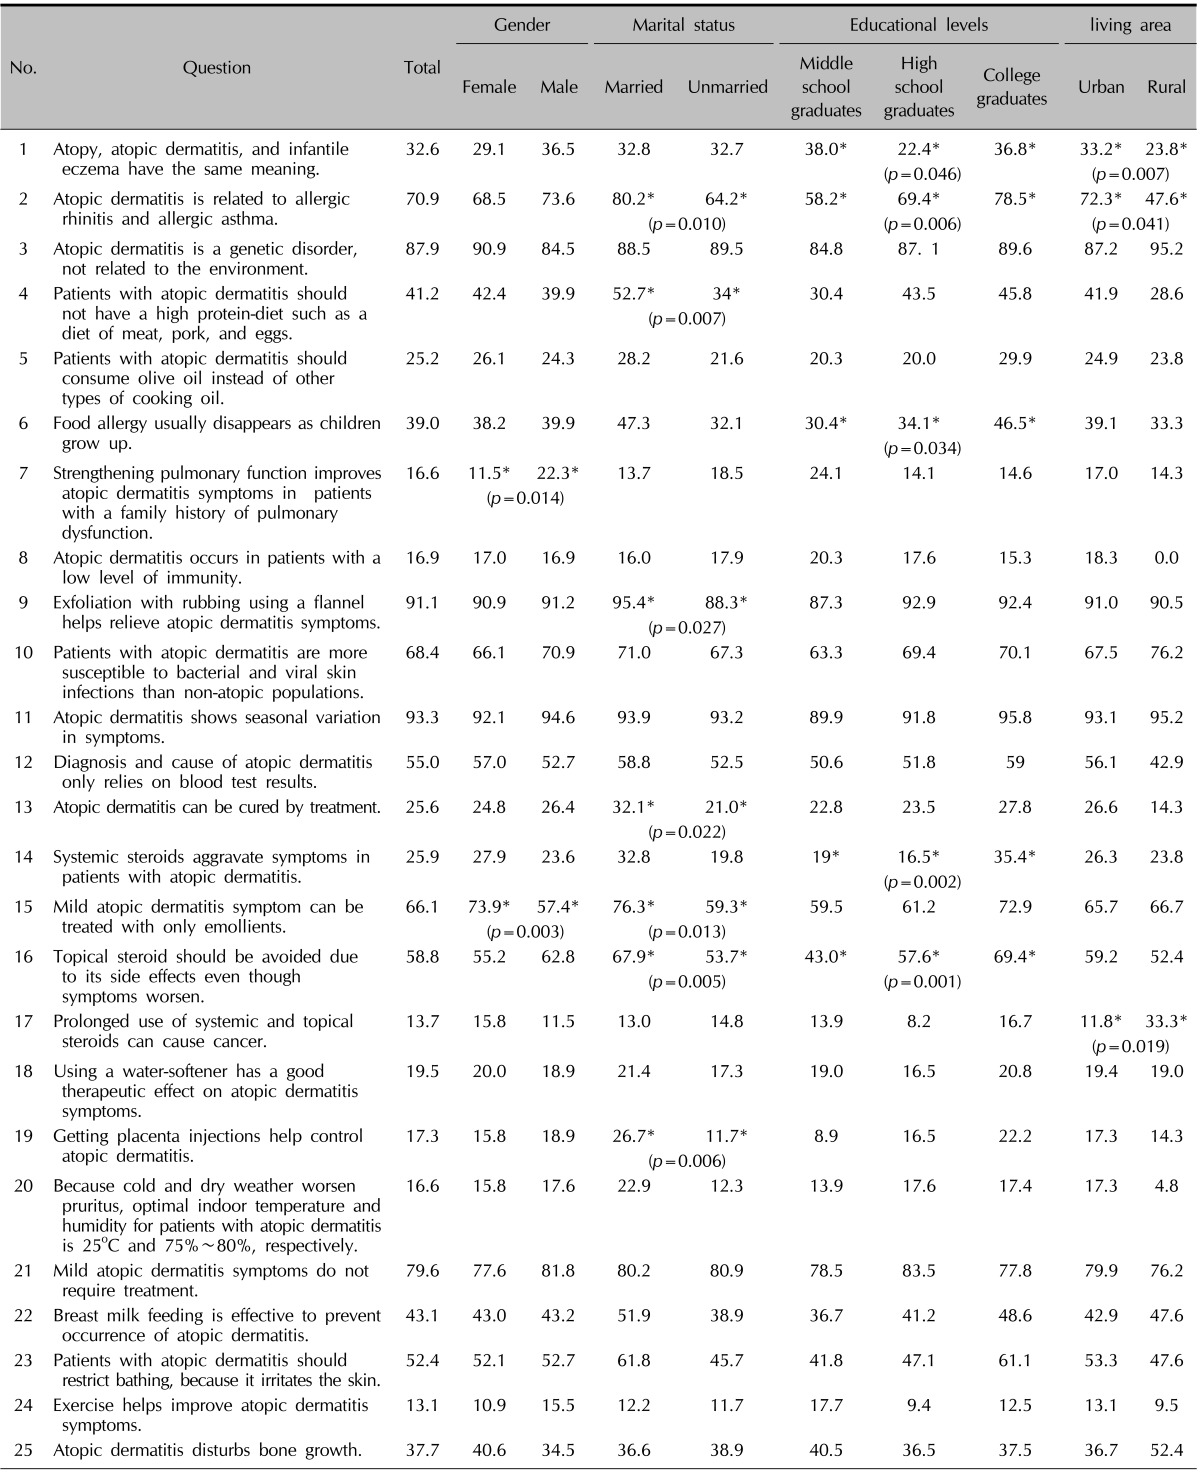
Table 1.
Percentage of correct answers of all questionnaires according to demographic characteristics

*Chi-squared test, A p-value <0.05 was considered as statistically significant.
Percentage of correct answers of all questionnaires according to demographic characteristics

*Chi-squared test, A p-value <0.05 was considered as statistically significant.