Figure 1.
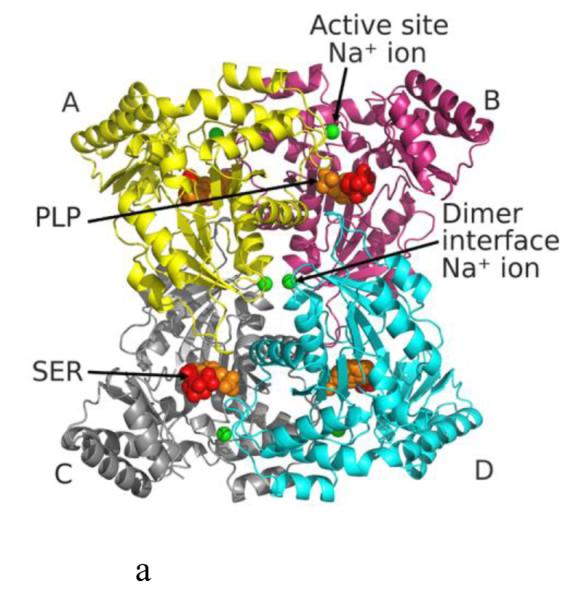
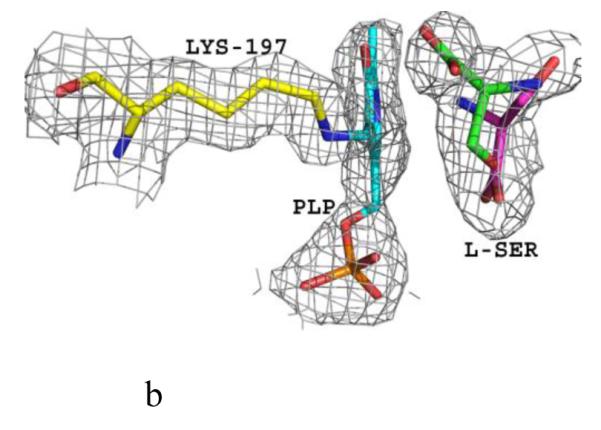
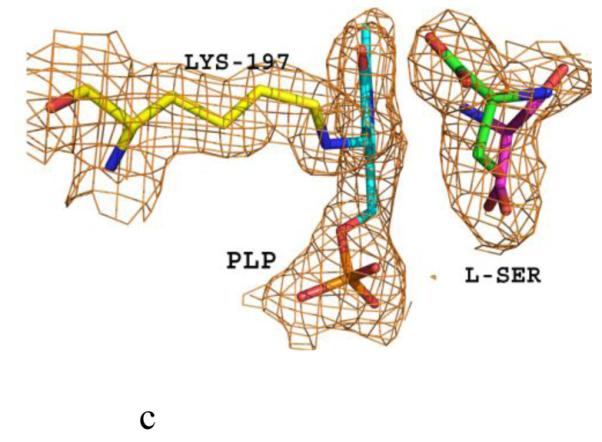
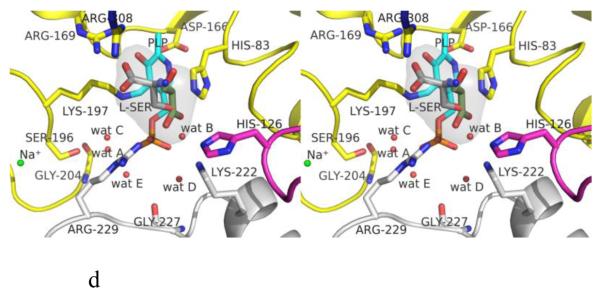
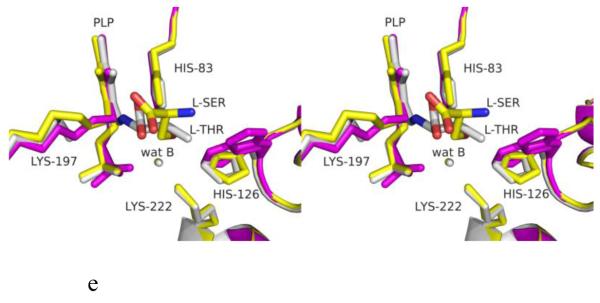
Structure of eTA. (A) Tetrameric structure of eTA-Ser-pH5.6 (in ribbons) in complex with L-serine (red spheres), PLP (orange spheres) and six Na ions (green spheres). Monomers A, B, C and D are in yellow, magenta, grey and cyan, respectively. (B) A 2Fo-Fc omit map (omitting Lys197, PLP and L-serine) shown at 0.9σ level for eTA-Ser-pH5.6. PLP is in the internal aldimine form, as shown by the continuous electron density between Lys197 and the cofactor. The map is superimposed with the final refined model. (C) A final refined 2Fo-Fc map shown at 0.9σ level for eTA-Ser-pH5.6. (D) Stereo-view of the monomer A active site of eTA-Ser-pH5.6 with the internal-aldimine bound PLP (cyan) and noncovalently bound L-serine (grey) in two alternate conformations. Na ion and water molecules are green and red spheres, respectively. (E) Stereo-view comparison of active sites of eTA-ser-pH5.6 (yellow), unliganded eTA-pH7.5 (magenta) and eTA-Thr-pH7.5 (white).
