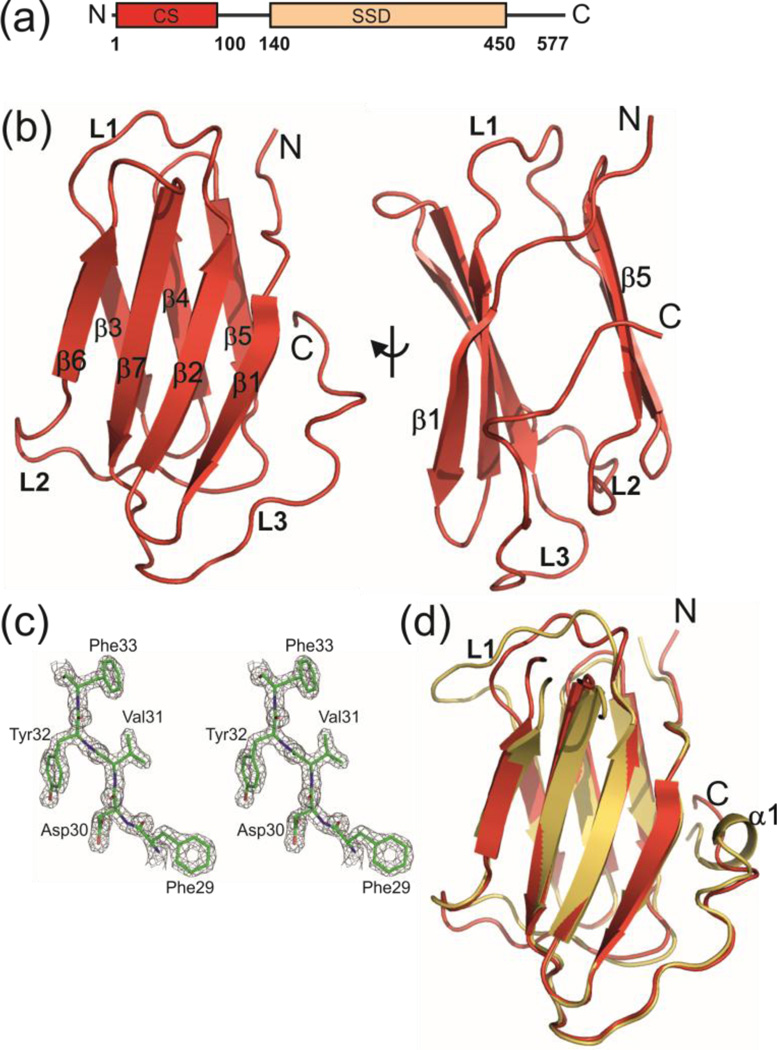
Fig. 1.
Crystal structure of N-terminal CS domain of human Shq1 with 6XHis-tag (his-hCS). (a) Domain organization of human Shq1 with CS domain and SSD indicated. (b) Ribbon representation of his-hCS structure. All the secondary structure elements and loops are marked. Front and side views are shown. (c) Stereo view of representative (residues F29-F33 of β3 strand) 2Fo-Fc electron density map of his-hCS contoured at 1.5σ and superimposed with the final model of the structure (d) Comparison of human Shq1 CS domain (his-hCS, red) and yeast Shq1 CS (yCS, gold) structures in ribbon representation.

