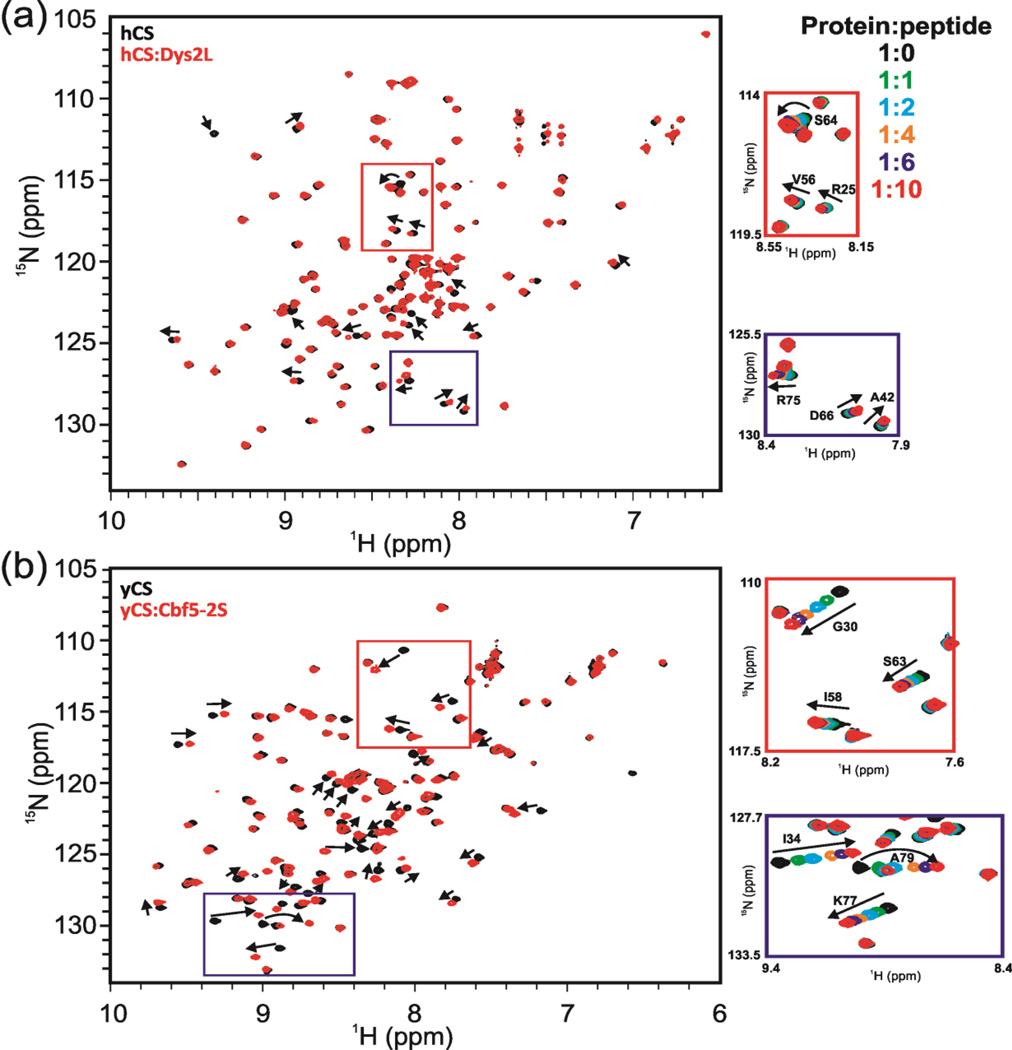
Fig. 2.
1H-15N HSQC spectra show specific binding between Shq1 CS domains (human and yeast) and dyskerin/Cbf5 peptides. (a) Interaction of Dys2L peptide with hCS. Overlay of 1H-15N HSQC spectra of hCS (black) and hCS:Dys2L peptide at 1:10 molar ratio (red). A few peaks showing chemical shifts are marked with arrows as examples. Red and blue boxed regions are shown expanded at right with overlay of spectra for multiple steps of the titration. Crosspeaks at each step in the titration are shown in different colors and the color code is shown. Crosspeaks that shift during the titration are labeled. (b) Titration of Cbf5-2S peptide with yCS. Overlay of 1H-15N HSQC spectra of yCS (black) and yCS:DCbf5-2L peptide at 1:10 molar ratio (red). A few peaks showing chemical shifts are marked with arrows as examples. Red and blue boxed regions are shown expanded at right with overlay of spectra for multiple steps of the titration. Protein:peptide ratios and color code are the same as in (a).

