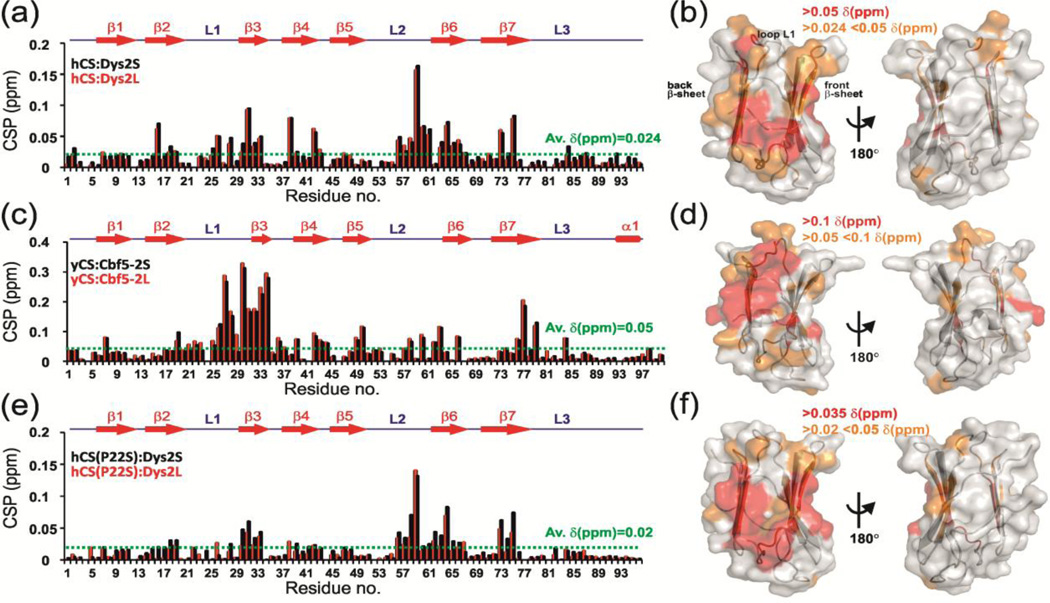
Fig. 3.
NMR chemical shift perturbation (CSP) studies reveal a conserved surface on Shq1 CS domain for dyskerin/Cbf5 binding. (a, c, e) Plot of CSP vs. residue number and (b, d, f) CSP mapped on CS structure for interaction of (a, b) hCS with Dys2S/L, (c, d) yCS with Cbf5-2S/L and (e, f) hCS(P22S) with Dys2S/L. In (a, c, e) the CS secondary structure is shown on top. CSP are for 1:10 protein:peptide ratio and are shown in black and red, respectively, for (a) hCS:Dys2S and hCS:Dys2L, (c) yCS:Cbf5-2S and yCS:Cbf5-2L, and (d) hCS(P22S):Dys2S and hCS(P22S):Dys2L. Dotted green line shows the average chemical shift differences upon peptide addition. In (b,d,f) different limits to classify shifts as strong (red) and weak (orange) are noted on each panel. Two views are represented, showing surface that is perturbed and 180° rotation showing no significant perturbation. ‘Back’ and ‘front’ β-sheets as well as L1 loop are marked.

