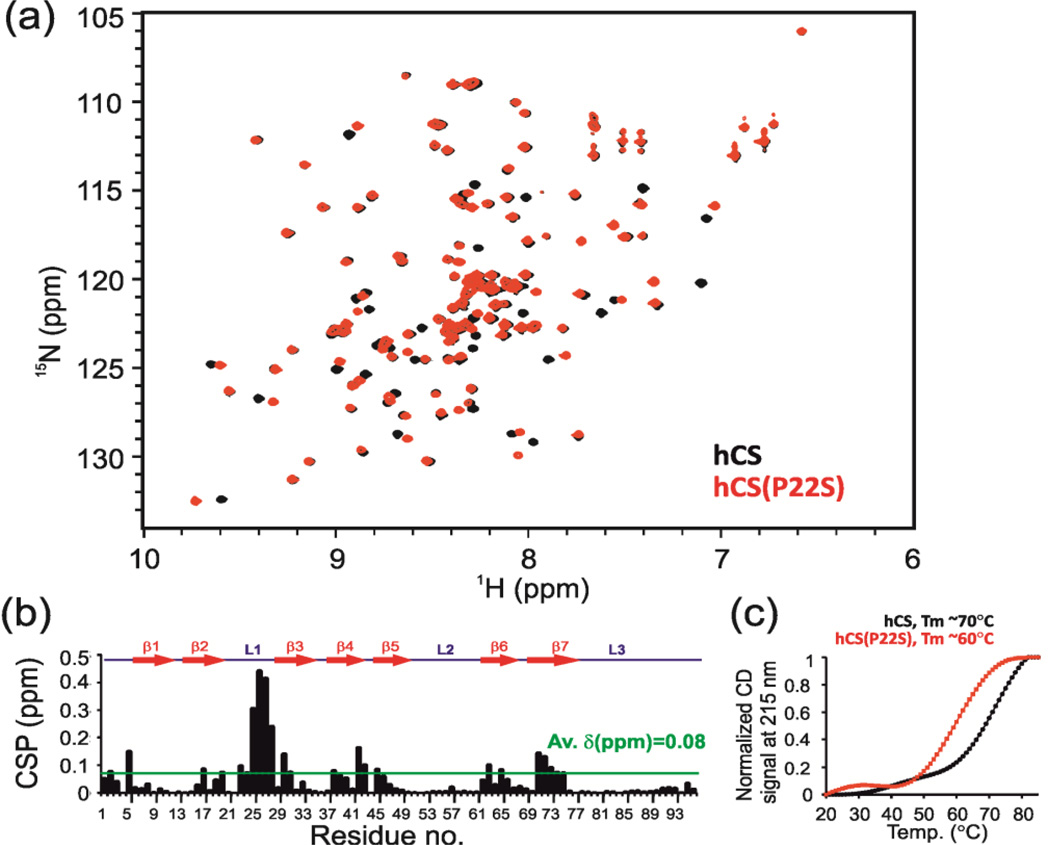
Fig. 6.
Comparison of hCS and hCS(P22S). (a) An overlay of 1H-15N HSQC spectra of hCS (black) and hCS(P22S) (red). (b) A plot of the chemical shift difference in backbone amides of hCS and hCS(P22S) vs. residue number. Secondary structure is drawn on top. Dotted green line depicts the average chemical shift differences between the two proteins. (c) Comparison of thermal melting profile of hCS and hCS(P22S) using CD spectroscopy. The estimated melting temperatures of hCS and hCS(P22S) are ~70°C and 60°C respectively.

