
Figure 3.
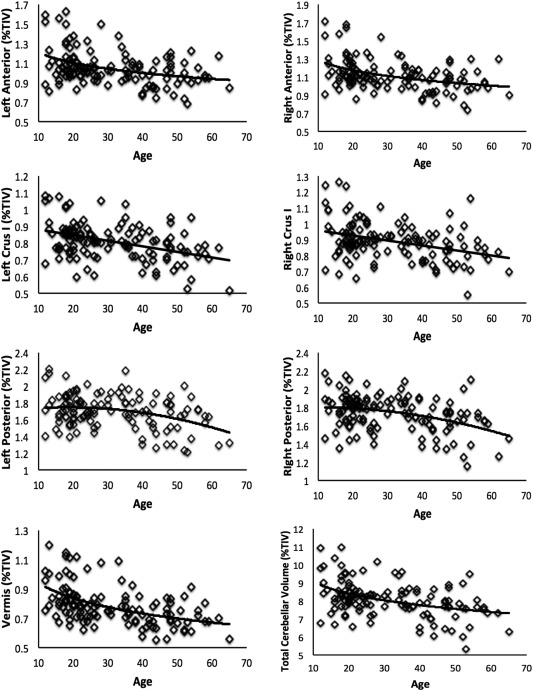
Relationships between regional cerebellar gray matter volume and age, as well as total cerebellar gray matter volume. All relationships with age were statistically significant. The anterior cerebellum was modeled with a logarithmic function, while Crus I was fit with a linear model, and the posterior cerebellum with a quadratic model. Like the anterior cerebellum, the cerebellar vermis was fit with a logarithmic model. Finally, total cerebellar volume was modeled with a logarithmic fit. However, a linear model fit the data equally well. We present the logarithmic fit here.