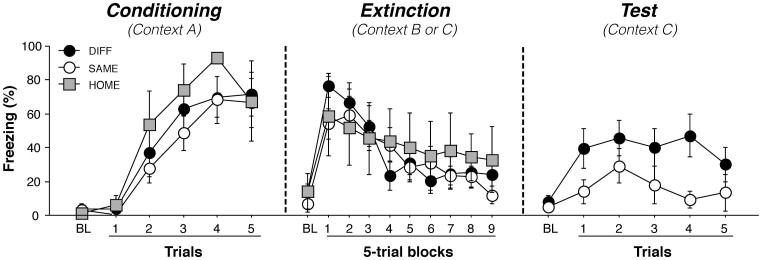
Figure 1. Conditioned freezing behavior.
(A), Mean (±SEM) percentage of freezing during fear conditioning. Freezing was averaged across the 3-min pre-CS baseline (BL) as well as during each of the five conditioning trials; each trial consisted of the average of freezing during each CS presentation and the subsequent ITI. (B), Mean (±SEM) percentage of freezing during the 45 tone-alone extinction session. Freezing was averaged across the BL period as well as during the 45 extinction trials; as with conditioning, each trial consisted of the average of freezing during each CS presentation and subsequent ITI (data are presented as 9 five-trial blocks). (C), Mean (±SEM) percentage of freezing during the test session, which consisted of five tone-alone presentations with 30 s ITIs. Freezing was measured during the BL period and during the five trials, each of which consisted of a CS presentation and the subsequent ITI. Data are shown for rats that were tested outside the extinction context (DIFF; black circles), tested within the extinction context (SAME; white circles), or not tested at all (HOME; gray squares).

