
Figure 2.
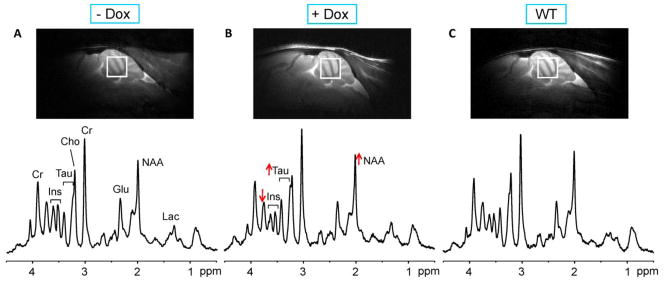
Voxel placement and spectral quality in condSCA1[82Q] and WT mice. Mid-sagittal T2-weighted images and localized proton MR spectra (LASER, TE = 15 ms, TR = 5 s) obtained at 24 weeks of age are shown for an untreated condSCA1[82Q] mouse (A), a doxycycline treated condSCA1[82Q] mouse (B) and a WT mouse (C). The voxel position for the spectra is shown on each image. The spectra were processed identically, weighted with the same Gaussian function prior to Fourier transformation and scaled based on neurochemical concentrations obtained by LCModel. The alterations in N-acetylaspartate (NAA), myo-inositol (Ins) and taurine (Tau) with treatment are shown with arrows. Other prominent peaks in the spectra are marked: creatine (Cr), choline (Cho), glutamate (Glu), lactate (Lac).