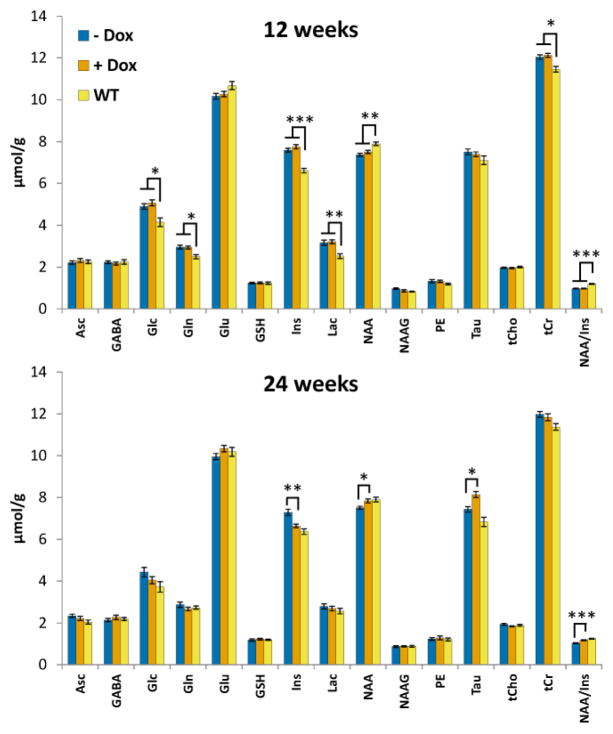
Figure 3.
Cerebellar neurochemical profiles of the untreated condSCA1[82Q] (− Dox), doxycycline treated condSCA1[82Q] (+ Dox) and WT mice (N=14 per group) at 12 and 24 weeks. Error bars shown are SEM. For simplicity, only the significant differences between the combined (treated + untreated) condSCA1[82Q] mice vs. WT are shown at 12 weeks (since there were no significant differences between the condSCA1[82Q] mice randomly assigned to treatment vs. no treatment before doxycycline administration, see Table 1) and only the significant differences between treated vs. untreated condSCA1[82Q] mice are shown at 24 weeks. * p < 0.05, ** p < 0.001, *** p < 0.0001, p-values corrected for multiple comparisons using the stepdown Bonferroni/Holm approach (Holm, 1979). Asc: ascorbate/vitamin C, GABA: γ-aminobutyric acid, Glc: glucose, Gln: glutamine, Glu: glutamate, GSH: glutathione, Ins: myo-inositol, Lac: lactate, NAA: N-acetylaspartate, NAAG: N-acetylaspartylglutamate, PE: phosphoethanolamine, Tau: taurine, tCho: glycerophosphocholine + phosphocholine, tCr: creatine + phosphocreatine.

