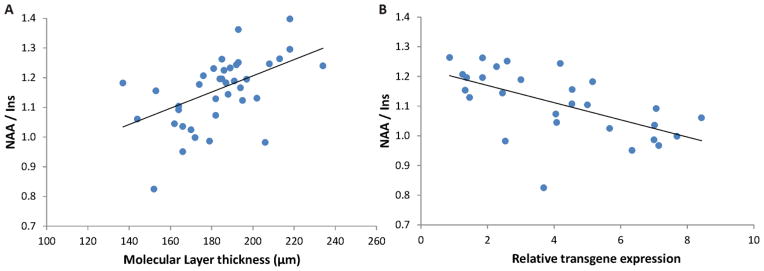
Figure 6.

Correlations between A) MRS and histology and B) MRS and qPCR measures. Data from all mice are shown in A), while only data from condSCA1[82Q] mice are shown in B since WT mice have no transgene expression. The NAA-to-myo-inositol ratio is significantly correlated with both molecular layer thickness at the primary fissure and relative transgene expression (p < 0.005).
