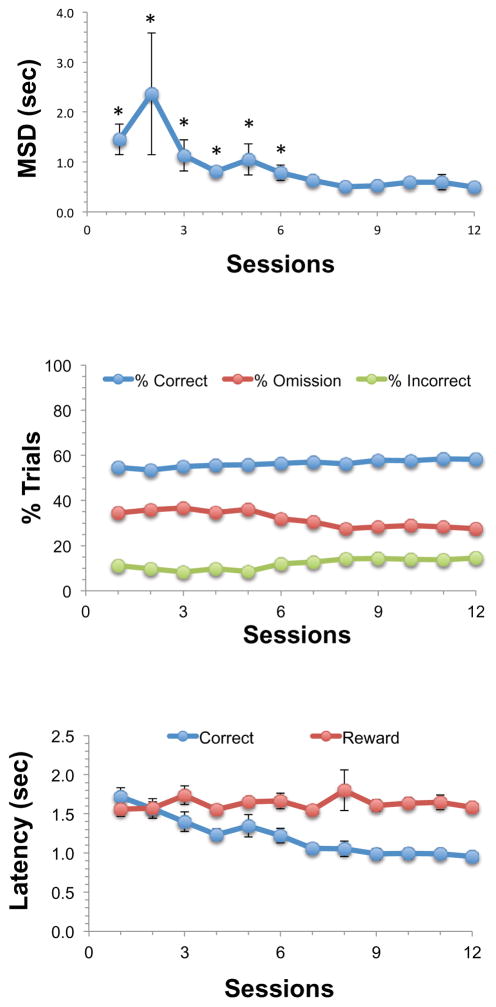
Figure 1. Stabilization of median cue duration (MCD) during training in the titration phase of the 5CSRTT titration procedure.
The MCD (mean ± SEM, N=24) was calculated from trials 15–100 for each subject beginning on the first session of access to the titration procedure. The MCD (mean±SEM) across the first 12 sessions of access to the titration procedure is shown in the upper panel. MCD decreased as a function of training session [Friedman statistic = 135.2, p<0.0001]. *, significantly different from session 12, p<0.05. The number of % correct, % omission, and %incorrect trials (mean±SEM) from these same sessions are shown in the middle panel. The lower panel shows the latency to respond correctly (Correct) or to retrieve the food reward (Reward) following a correct response (mean±SEM).

