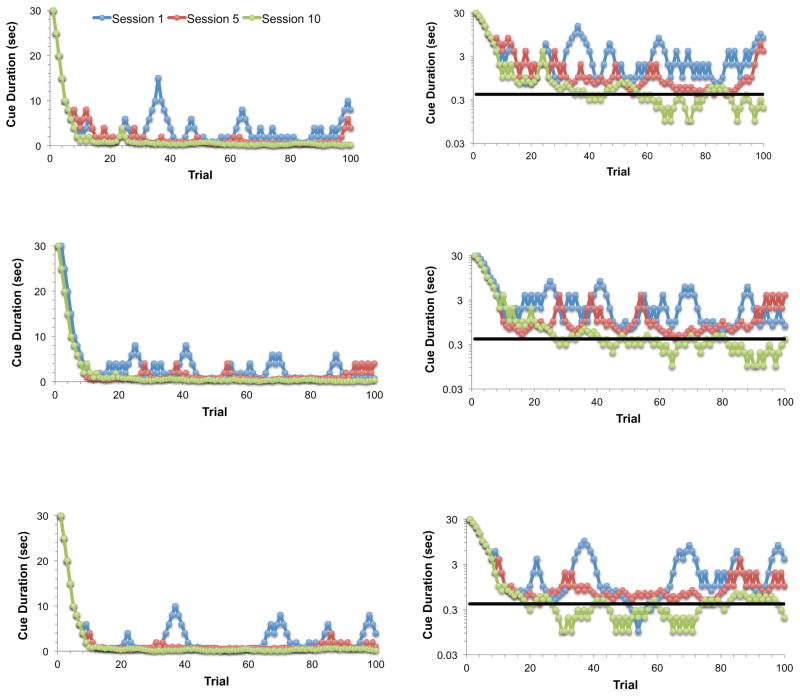
Figure 2. Cue duration titration curves during initial access to the 5CSRTT titration procedure.
Representative cue duration titration curves are shown for 3 different animals during the first, fifth, and tenth sessions of initial access. To more clearly view the titration during the stable portion of the curves, the cue duration is plotted using a log scale in the graphs to the right. The black line indicates the MCD for the tenth session.

