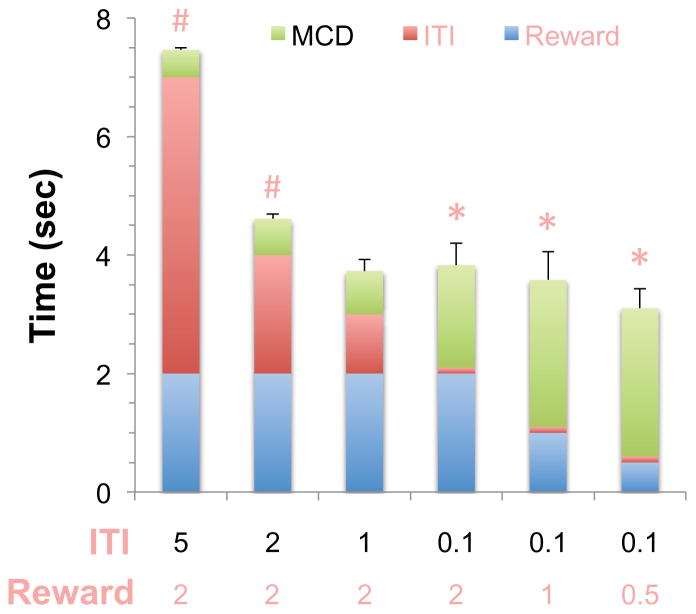
Figure 4. Effects of ITI and reward cycle duration on MCD.
The cumulative time required to perform the titration task from initiation of reward retrieval to visual cue duration is shown for different ITI and reward cycle durations. As the ITI and reward cycle durations were constants under each condition, the error bars indicate the SEM for the MCD calculated for each subject for sessions in which the indicated ITI and reward cycle duration were in effect. The leftmost bar indicates the standard baseline condition where ITI = 5 sec and the reward cycle = 2 sec. #, MCD + ITI + reward significantly different from condition where ITI = 0.1 sec and reward = 0.5 sec (rightmost bar on graph), p < 0.05. *, MCD significantly different from baseline condition, p < 0.05. N = 8.

