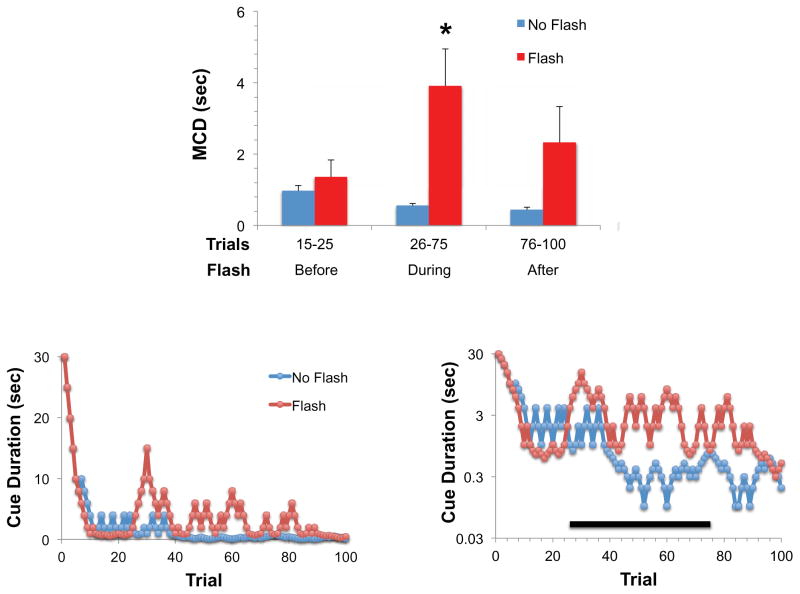
Figure 5. Effect of visual distractor on MCD.
Visual distraction was provided during trials 26–75 only in the form of a 3 Hz flashing light as described in Methods. The MCD was increased during trials in which the visual distractor was present but not in other trials compared to a normal session without the distractor (top panel, * significantly different from No Flash, p<0.017). The two lower panels show representative CD titration curves from the same subject with or without the flash present (left panel, linear scale; right panel, log scale). The black bar in the lower right graph indicates the trials during which the flashing distractor stimulus was presented.

