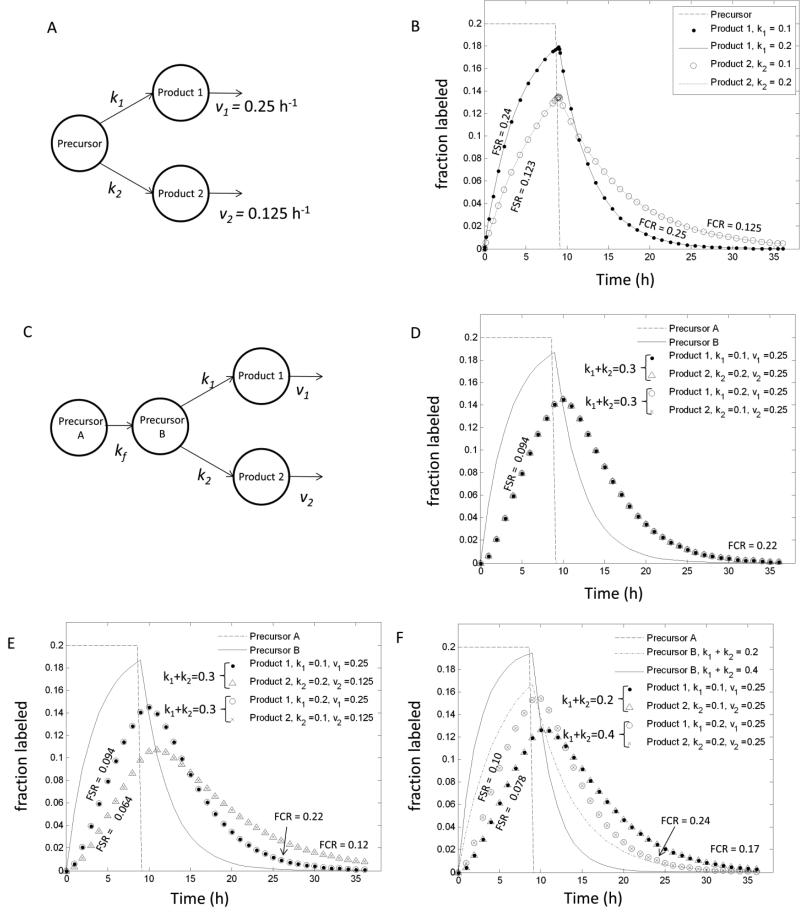
Figure 4. Fractional synthesis rate (FSR) and fractional clearance rate (FCR) for compartmental models with multiple pathways.
(A) A simple model of a single precursor with constant labeling fraction during the labeling phase, which produces two products. (B) The labeling kinetics of each product show that variation of the production rate constants (k1 & k2) have no effect on labeling kinetics. Variation of the clearance rate constants (v1 & v2) has the only impact on labeling kinetics, and FSR and FCR are both provide good estimates of v1 or v2. (C) A two-step model in which precursor A is maintained at constant concentration during the labeling phase, but produces a precursor B, which then produces two products. (D) With v1 & v2 given the same value, the values of k1 & k2 were set to different values, however, their sum remained constant. Regardless of the individual values of k1 & k2 the labeling curves for both products overlapped. FCR was close to but slightly lower than v1 & v2, while FSR was difficult to associate with any of the parameters. (E) The values of k1 & k2 were set to different values, however, their sum remained constant. The value of v1 was set to twice that of v2. Regardless of the individual values of k1 & k2 the labeling curves for each product overlapped. FCR was a close to but slightly lower than v1 or v2. FSR was 47% higher when the clearance rate constant was twice as large. (F) Production rate contants k1 & k2 were set equal to each other, but their sum was varied while setting v1 & v2 equal to each other. Changes in k1 + k2 led to distinct labeling curves. FCR approached the value of v1 & v2 when k1 + k2 became larger, but was much lower than v1 & v2 when k1 + k2 was lower. FSR increased by 28% when k1 + k2was doubled.

