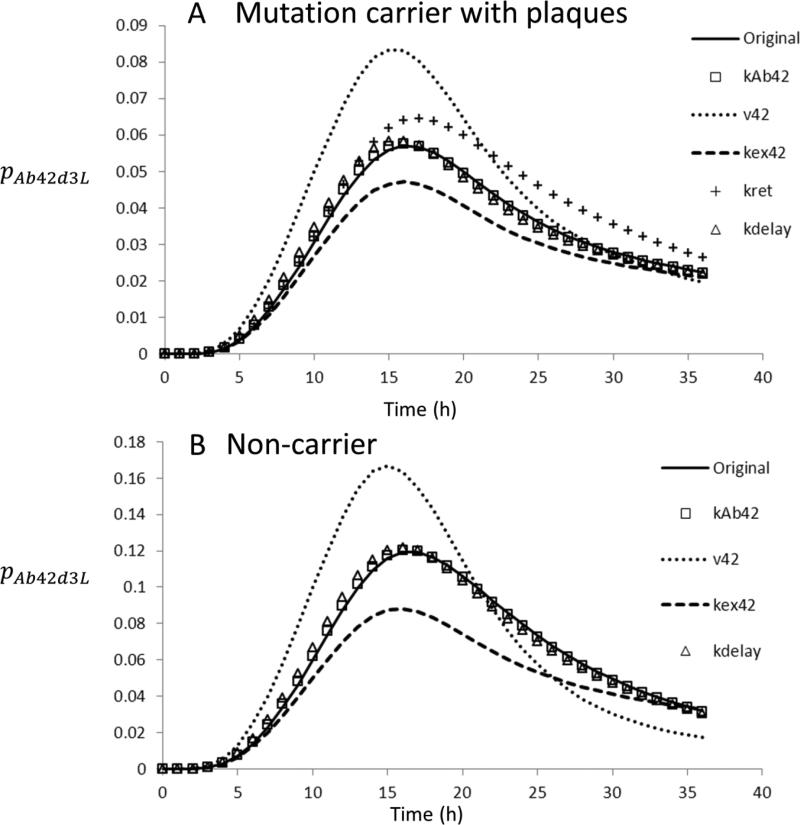
Figure 6. Changes in model predictions with changes in parameters.
The indicated parameter values were increased by 0.1 h−1. The rate equations were solved numerically with all other rate constants at their original values. (A) Presenilin-1 mutation carrier with plaques validated by PET PIB scans, (B) Non-carrier without plaques. The observed trends help to visualize the results of the sensitivity analysis shown in Figure 4.

