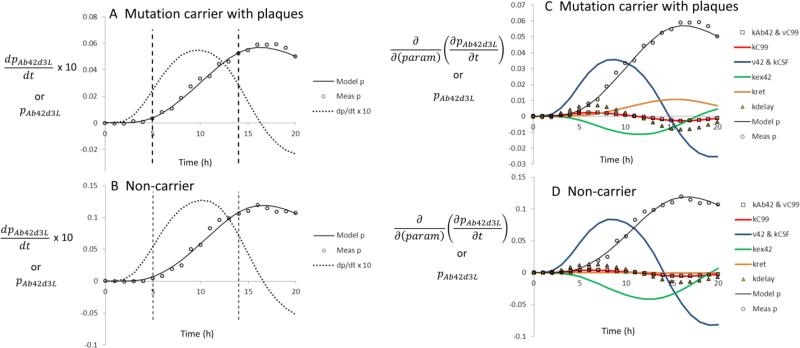
Figure 7. Sensitivity analysis of time derivative of exact solution.
The time derivative of the labeling time course between 5 and 14 hours has previously been used to estimate production rate constants of kinetic systems (reference [7]). (A&B) ‘Slope’ of the labeling curve (dpAb42d3L/dt; multiplied by 10 for readability) shows that the data are not well-described by a straight line between 5 and 14 hours. (C&D) The sensitivity of dpAb42d3L/dt with respect to changes in the various parameters was evaluated. Also plotted are the measured (‘Meas p’) and predicted (‘Model p’) fractional labeling. (A&C) Presenilin-1 mutation carrier with plaques validated by PET PIB scans, (B&D) Non-carrier without plaques.

