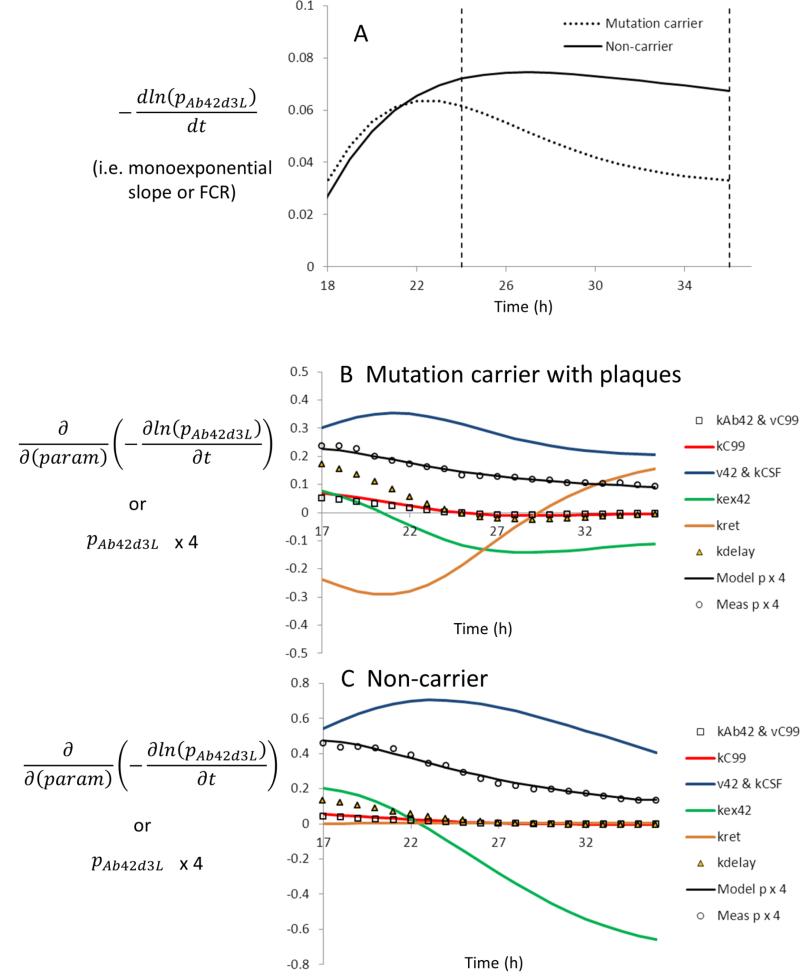
Figure 8. Sensitivity analysis of the monoexponential FCR.
The time derivative of the logarithm of the labeling time course was previously used to estimate ‘clearance’ kinetics between 24 and 36 hours (reference [7]). (A) The time derivative of −ln(pAb42d3L) is the instantaneous ‘monoexponential slope’ or FCR is shown for each subject. This is relatively constant for the non-carrier between 24 and 36 hours, but varies considerably for the mutation carrier. (B&C) The sensitivity of d(–ln(pAb42d3L))/dt to changes in parameter values was evaluated. Also plotted are the measured (‘Meas p’) and predicted (‘Model p’) fractional labeling, scaled by 4 for readability. (B) Presenilin-1 mutation carrier with plaques validated by PET PIB scans, (C) Non-carrier without plaques.

