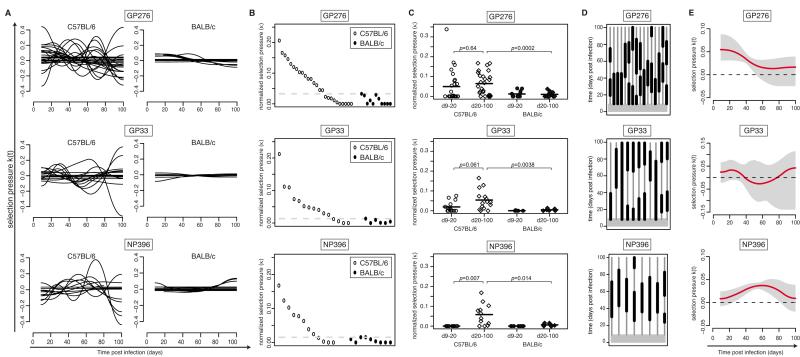
Figure 3. Interindividual diversity, magnitude and timing of epitope-specific CTL selection pressure.
A: Superimposition of k(t) curves from individual C57BL/6 (left) and BALB/c (right) mice, assessing selection pressure on the respective epitopes. B: Symbols represent the average selection pressure, κ, for individual C57BL/6 (white circles) and BALB/c mice (black circles) on the indicated epitopes over 100 days. Horizontal dashed lines denote the respective highest values recorded in BALB/c mice. C: Symbols represent the average epitope-specific selection pressure, κ, for individual C57BL/6 (white symbols) and BALB/c mice (black synbols) calculated for the period from day 9-20 or from day 20-100, as indicated. For pair-wise comparisons paired t tests (C57BL/6 d9-20 vs. C57BL/6 d20-100) and unpaired t tests (C57BL/6 d20-d100 vs. BALB/c d20-d100) were used. The resulting p-values were subject to Bonferroni correction for multiple comparisons. D: Time windows during which the TDSP k(t) curves of individual mice (Fig. 2 and Figs. S2-S4) are above the 95% confidence interval of background noise (see Methods). Individual mice are displayed as vertical lines, with thick segments denoting detectable selection pressure. Only C57BL/6 mice with average selection coefficients above BALB/c backgrounds (dashed lines in Fig. 3B) were included in the analysis. E: Derived TDSP based on all mice shown in (D). The mean (red line) and 95% confidence interval (grey shaded) of 10,000 bootstrap replicates are shown. The dashed line indicates the zero reference line, above which selection is recorded.

