FIGURE 6.

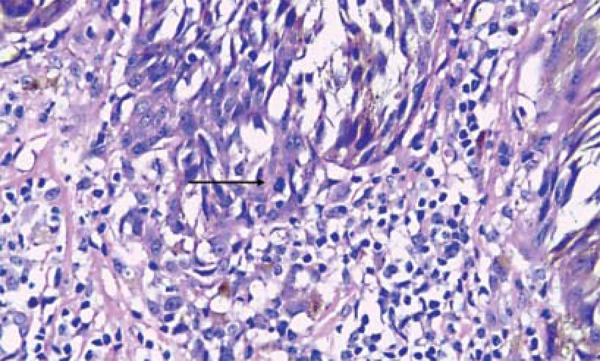
Atypical melanocytes with pleomorphism, hyperchromasia and mitotic figure at the base of an intraepidermal nest (arrow) (HE, 400x magnification)

Atypical melanocytes with pleomorphism, hyperchromasia and mitotic figure at the base of an intraepidermal nest (arrow) (HE, 400x magnification)