
Figure 6.
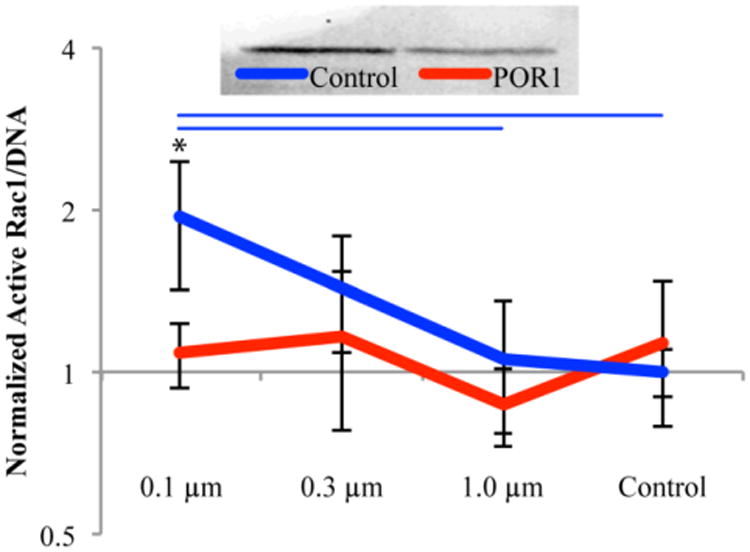
Western blot demonstrating knockdown of POR1 which was found to be approximately 50% based on the ratio of POR1 to Tubulin (top). Rac1 activation as a function of fiber diameter, 24 hours after seeding, normalized by DNA (bottom). All values were normalized against the control siRNA on control surfaces. Blue bars indicate significant difference between substrates within control siRNA treatment and * represents significance between siRNA treatments on the same substrate, p<0.05; n = 6, outliers removed