
Figure 8.
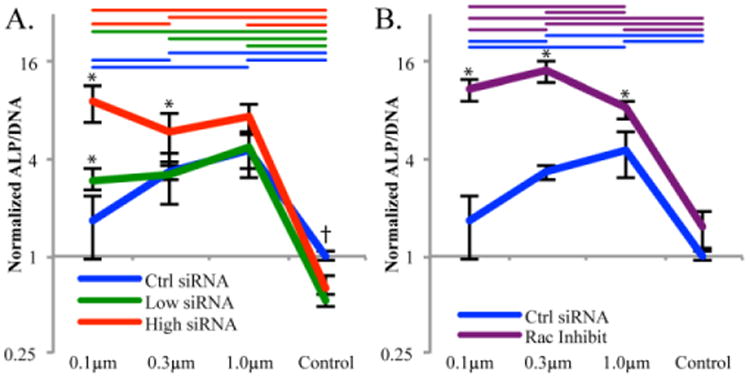
ALP/DNA after 3 days of growth. All samples normalized to the control siRNA cells on the control surface. A. demonstrates the effect that either a low or high concentration of siRNA had over the geometry sensing trend. B. demonstrates the effect of the Rac1 inhibitor NSC23766 on the geometry sensing trend. Colored coded bars indicate significance, p<0.05, between substrates with the same siRNA/Rac1 inhibitor, whereas * represents significance between siRNA or inhibitor and the control on the same substrate and † represents significance between the control treatment and both siRNA treatments. n = 6, outliers removed.