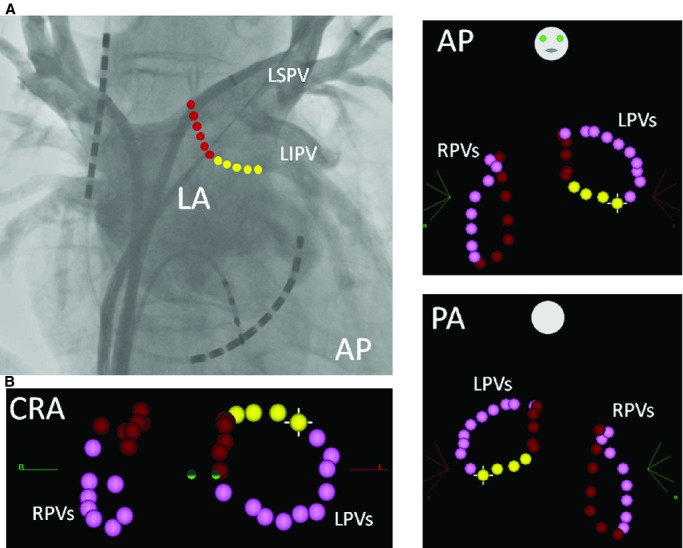
Figure 2.

A, A point‐by‐point RF ablation line on the posterior LA is shown on the pulmonary venography image. B, A point‐by‐point circumferential ablation line is shown on a 3‐dimensional mapping system (CARTO3). Each dot indicates 1 RF application with a duration of 30 seconds. The pink dots show the ablation points on the anterior part of the PVs, and the red (longitudinal line) and yellow dots (transverse line) show the ablation points on the posterior LA. After August 2011, the energy power was limited to 20 to 25 W at the sites where the ablation line transversed the esophagus (yellow dots). AP indicates anteroposterior view; CRA, cranial view; LA, left atrium; LIPV, left inferior PV; LPVs, left pulmonary veins; LSPV, left superior PV; PA, posteroanterior view; PV, pulmonary vein; RF, radiofrequency; RPVs, right pulmonary veins.
