
Figure 1.
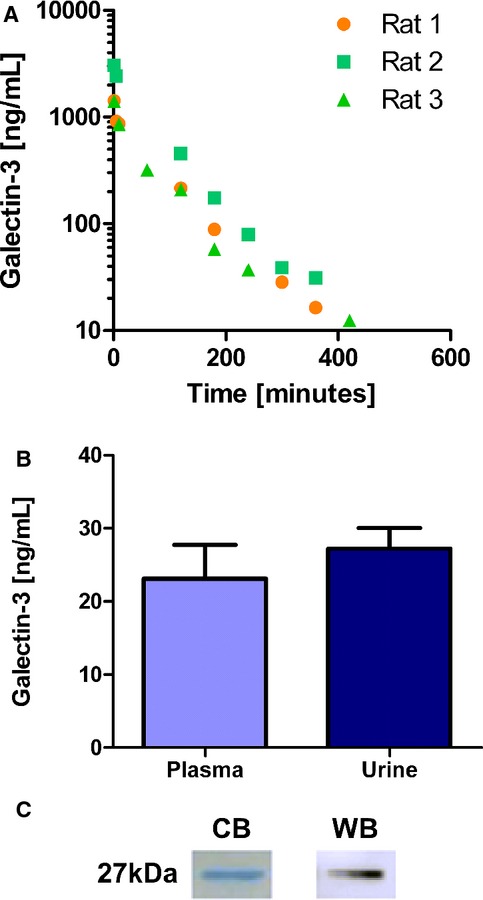
Experimental data. A, Displays the galectin‐3 concentration over time after a single bolus IV injection (3 rats/group; saline‐infused rats are not displayed because they did not show any recombinant‐human‐galectin‐3). B, Displays the plasma and urine galectin‐3 level of rats having received a continuous infusion of galectin‐3 via an osmotic minipump (n=3); not significant. C, Staining of recombinant human galectin‐3. CB indicates Coomassie blue staining; WB, Western blot.