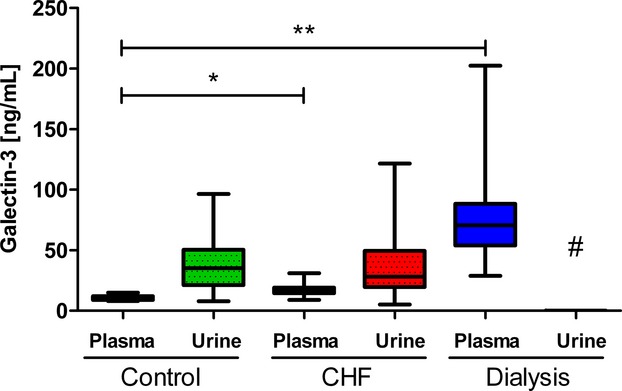
Figure 2.

Plasma and urine galectin‐3 concentrations in 3 different cohorts. Overview of the plasma and urine galectin‐3 concentrations in the 3 cohorts (control [n=20], CHF [n=101], and hemodialysis [n=105]). Data are displayed as medians with IQR. Statistical test: Mann–Whitney U test. *P<0.05 control galectin‐3 plasma compared to CHF galectin‐3 plasma. **P<0.05 control galectin‐3 plasma compared to dialysis galectin‐3 plasma. #Hemodialysis patients were not obtained so no values could be measured. CHF indicates chronic heart failure; IQR, interquartile ranges.
