
Figure 3.
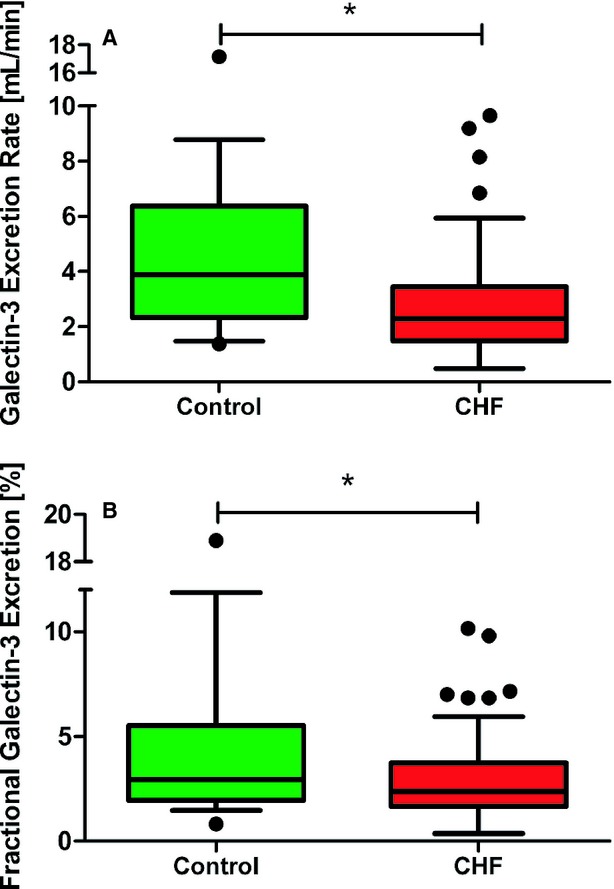
Renal handling of galectin‐3. A, Shows the galectin‐3 excretion rate difference between control subjects and heart failure patients. B, Displays the difference in the proportion of actually excreted galectin‐3 in percentage between control subjects and heart failure patients. *P<0.05 control subjects compared to heart failure patients (n=20 vs n=101). Data are displayed as medians with IQR. Statistical test: Mann–Whitney U test. CHF indicates chronic heart failure; IQR, interquartile ranges.