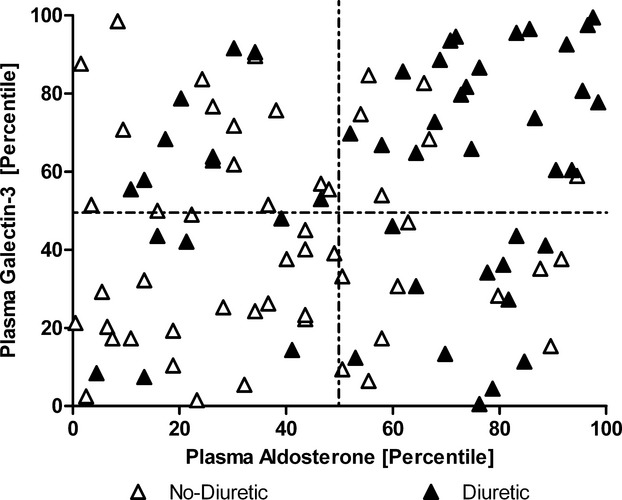
Figure 6.

Distribution of plasma aldosterone and galectin‐3 and further stratified by diuretic and nondiuretic users. Displays the distribution of the heart failure patients based upon plasma galectin‐3 level (percentile) and plasma aldosterone level (percentile). The cohort is divided based upon the use of diuretics. As shown in the upper right quadrant, 45% of the patients on diuretics are present and only 8% of the patients without diuretics.
