
Figure 1.
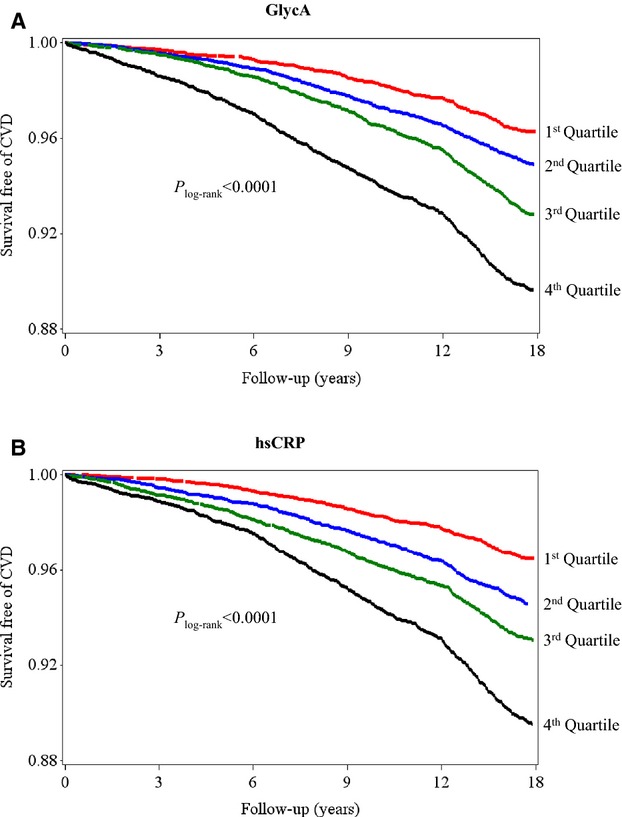
Kaplan–Meier curves of incident CVD according to quartiles of GlycA (A) and hsCRP (B). Quartile concentrations were ≤326, 327 to 369, 370 to 416, and ≥417 μmol/L for GlycA and ≤0.81, 0.82 to 2.03, 2.04 to 4.38, and ≥4.39 mg/L for hsCRP. CVD indicates cardiovascular disease; hsCRP, high‐sensitivity C‐reactive protein.