
Figure 1.
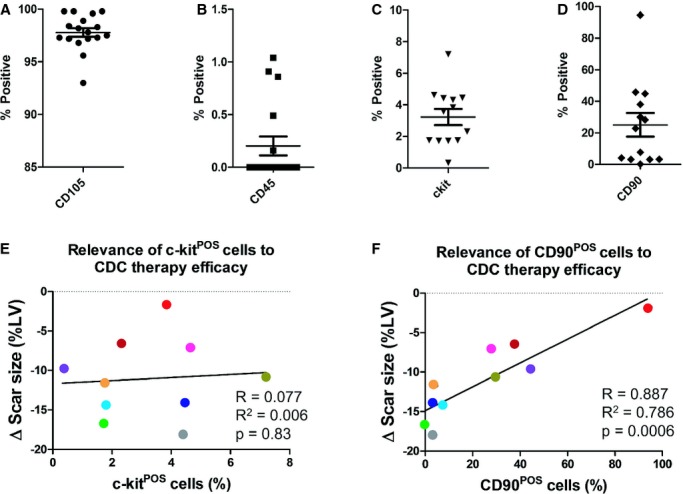
Correlations of c‐kit and CD90 expression with therapeutic efficacy of CDCs in the CADUCEUS trial. A through C, Flow cytometry analysis of CD105, CD45, c‐kit, and CD90 expression in the patient CDCs used in the CADUCEUS trial. Each colored bar represents an individual patient's CDC line. Black bars represent an average from all the patients. E and F, Linear regression analysis is performed to reveal the relationship between c‐kit or CD90 expression and the changes in the patients' cardiac scar size (ie, scar mass divided by total left ventricular mass) by contrast‐enhanced cardiac MRI over the 12 month follow‐up. Each dot represents an individual patient and its color matches that of the bars in C and D. Error bars=SDs. CDCs indicates cardiosphere‐derived cells; LV, left ventricular; MRI, magnetic resonance imaging.