
Figure 3.
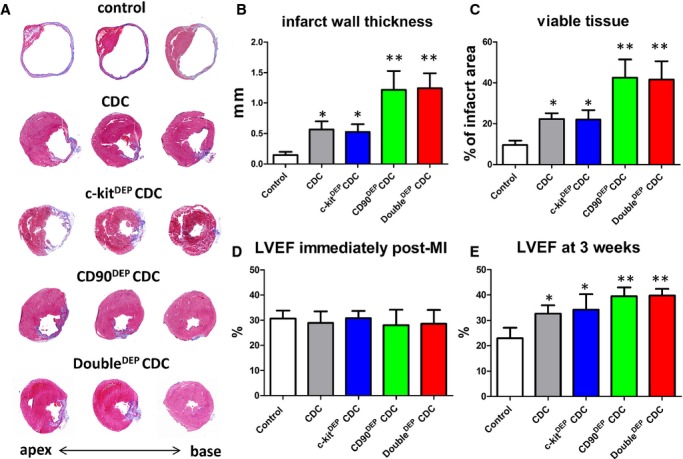
Therapeutic potencies of c‐kitDEP, CD90DEP, and DoubleDEP CDCs in a mouse model of myocardial infarction. A, Representative Masson's trichrome‐stained myocardial sections 3 weeks after treatment with control (vehicle only), unsorted CDCs, ckitDEP CDCs, CD90DEP CDCs, and DoubleDEP CDCs. Scar tissue and viable myocardium are identified by blue and red color, respectively. B and C, Quantitative analysis of infarct thickness and viable tissue size from the Masson's trichrome images (n=5 animals per group). D and E, Left ventricular ejection fraction (LVEF) was measured by echocardiography at baseline (4 hours post‐MI) (D) and 3 weeks afterward (E). *P<0.05, when compared to control; **P<0.05, when compared to any other group. Error bars=SDs. CDCs indicates cardiosphere‐derived cells; MI, myocardial infarction.