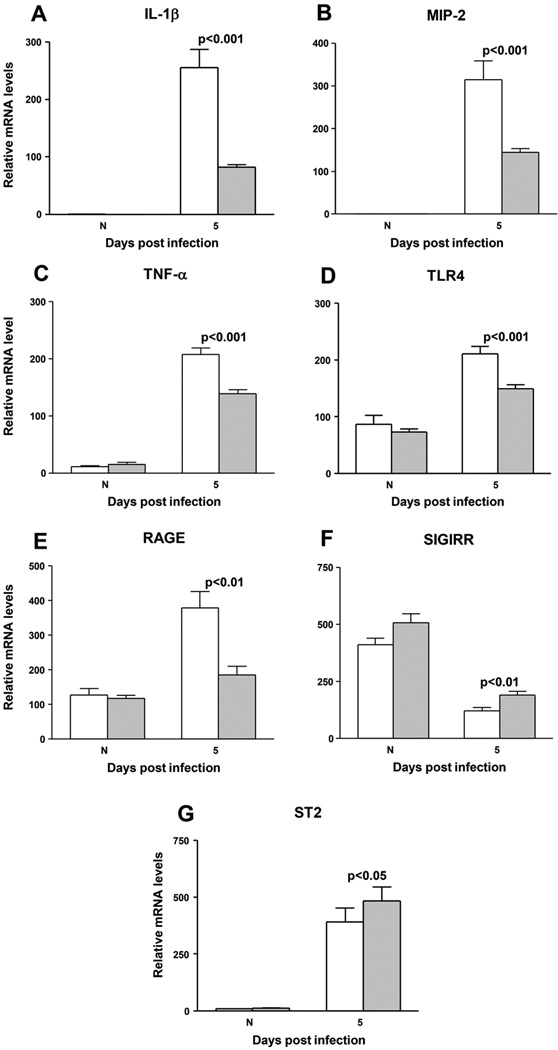
Figure 4. Real time RT-PCR.
RT-PCR revealed significantly reduced expression of mRNA for (A) IL-1β (p<0.001), (B) MIP-2 (p<0.001), (C) TNF-α (p<0.001), (D) TLR4 (p<0.001), and (E) RAGE (p<0.01) after silencing HMGB1. mRNA expression for (F) SIGIRR and (G) ST2 were significantly elevated after HMGB1 silencing (p<0.01 and 0.05, respectively) (n=5/group/time). Data shown in (A–G) analyzed using a two-tailed Student’s t-test and shown as the mean ± SEM.

