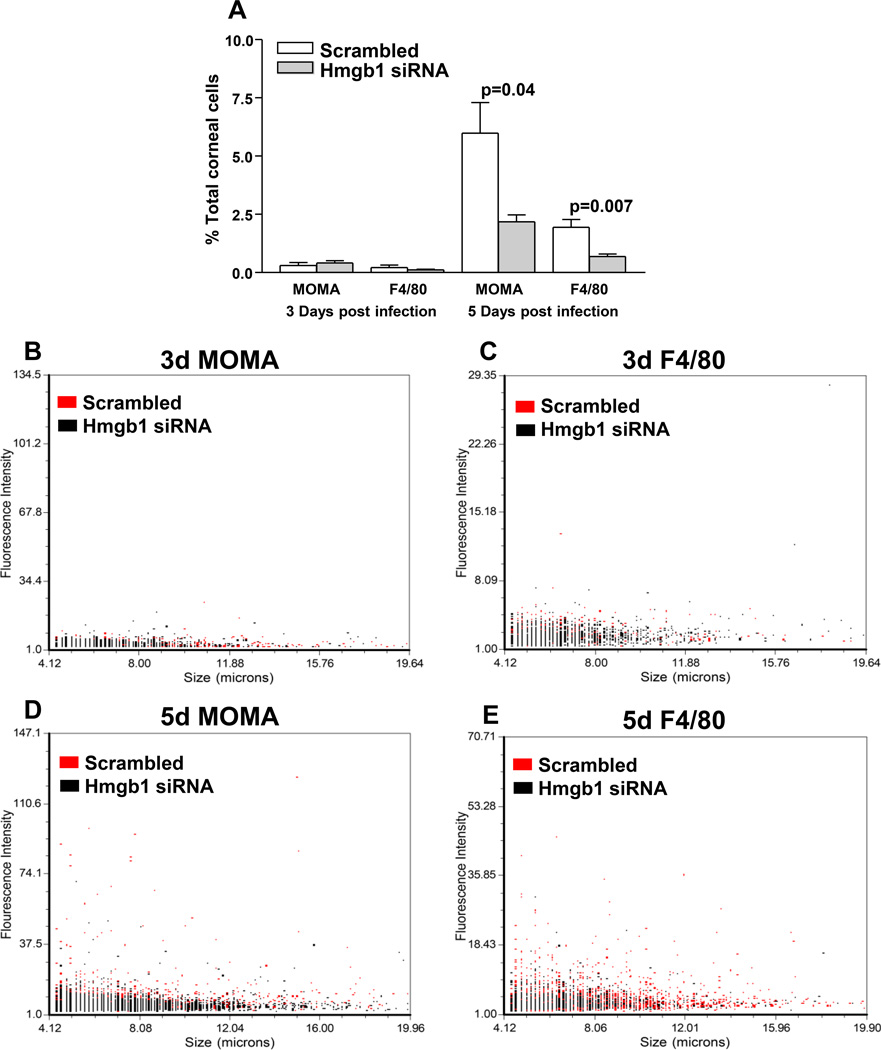
Figure 7. Cell analysis.
MOMA and F4/80 positive cells, assayed separately, were no different between groups at 3 days p.i.; at 5 days p.i., fewer MOMA positive (p=0.04) cells and fewer F4/80 positive cells (p=0.007) were seen after siHMGB1 when compared to scrambled control treatment (A). (n=5/group/time/assay). Dot plots (B–E), show no differences between groups at 3 days, but at 5 days, siHMGB1 treatment reduced intermediate and large size cell populations when compared with scrambled control treatment. Data shown in (A) analyzed using a two-tailed Student’s t-test and shown as the mean ± SEM.

