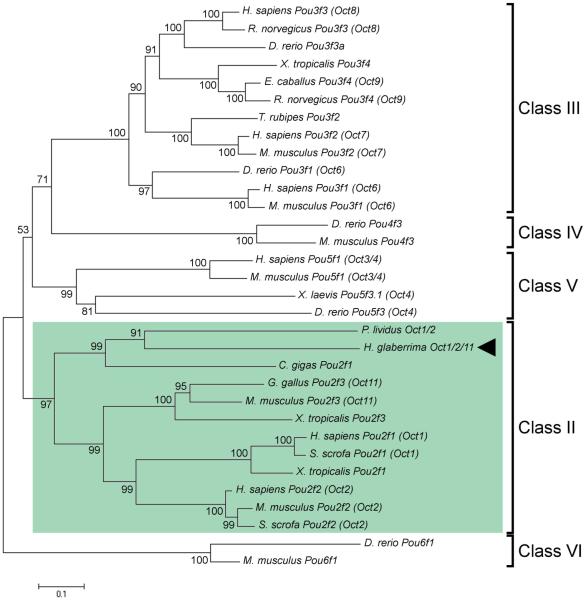
Fig. 2.
Evolutionary relationships between Oct1/2/11 of H. glaberrima (arrowhead ) and homologous POU proteins in other animals. Green rectangle indicates class II of POU transcription factors. The numbers at branch nodes indicate the percentage of recovery of the branch in replicate trees in the bootstrap test. The tree is drawn to scale. The evolutionary distances were calculated using maximum composite likelihood method and are represented as number of base substitutions per site. The database accession numbers of the sequences used in the phylogenetic analysis are listed in Electronic Supplementary Material, Table S1

