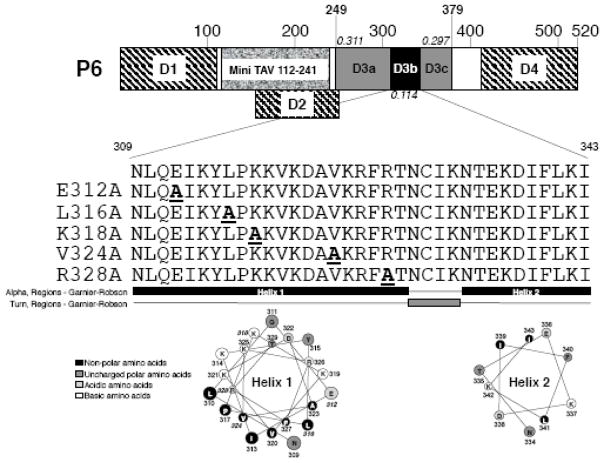
Fig. 1.
Schematic diagram of P6 and location of mutations. The 520 amino acid P6 protein is indicated; large numbers above box indicate amino acids. Hatched areas, P6 regions involved in self-association) (Haas et al., 2005; Li and Leisner, 2002); granular region Mini-TAV region (De Tapia et al., 1993); D1 (amino acids 1-110); D2 (amino acids 156-253); shaded area, D3 (amino acids 249-379); D4 (amino acids 414-520). D3a and D3c are indicated (note both contain RNA-binding domains); black area, D3b examined in this study. Numbers in italics: number of variable amino acid positions within that portion of P6 per amino acid. The amino acid sequence of the D3b region is shown below the P6 cartoon as well as the amino acid changes for the various mutants, single letter amino acid designations are given. The D3b region is likely α-helical (black) with an intervening turn (gray) below the sequences as predicted by Garnier-Robson model in the Protean software contained within the Lasergene Software package. Helical wheels for both helices (predicted by the Protean software package) are indicated below the secondary structure prediction; black, non-polar amino acids; dark gray, uncharged polar amino acids; light gray, acidic amino acids; white, basic amino acids; amino acid numbers are given; bold italic numbers, amino acids mutated.

