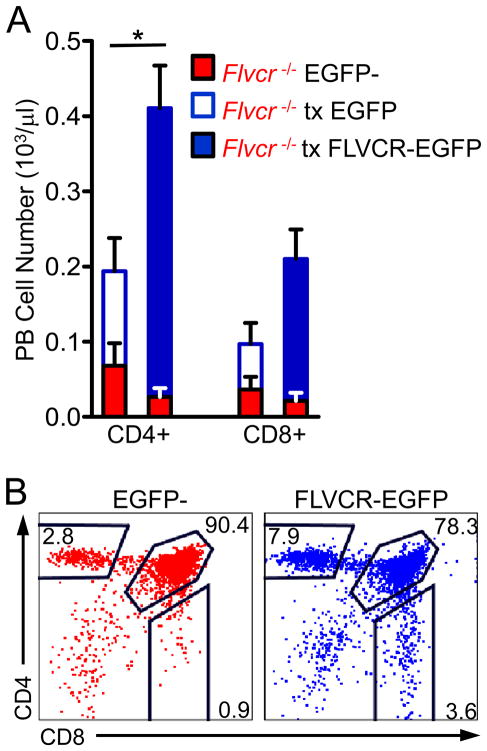
FIGURE 5.
FLVCR re-expression in Flvcrflox/flox;Lck-cre BM rescues T cell development. (A) Absolute numbers of CD4+ and CD8+ peripheral blood lymphocytes. Red bars show numbers of EGFP-negative (non-transduced) Flvcrflox/flox;Lck-cre lymphocytes while blue bars show numbers of EGFP-positive lymphocytes transduced (tx) either with EGFP only (open) or FLVCR-EGFP (filled). The bars show the mean and s.e.m. of 3–4 mice per group. *p=0.02 (comparison between EGFP-transduced and FLVCR-EGFP-transduced). (B) Representative flow plots of thymocytes from a recipient of Flvcrflox/flox;Lck-cre BM transduced with FLVCR-EGFP. The left plot shows CD4 versus CD8 staining of the EGFP-negative (non-transduced) thymocytes while the right plot shows EGFP-positive (FLVCR-EGFP-transduced) thymocytes from the same mouse. The data are representative of 2 experiments with 3–5 mice per group.

