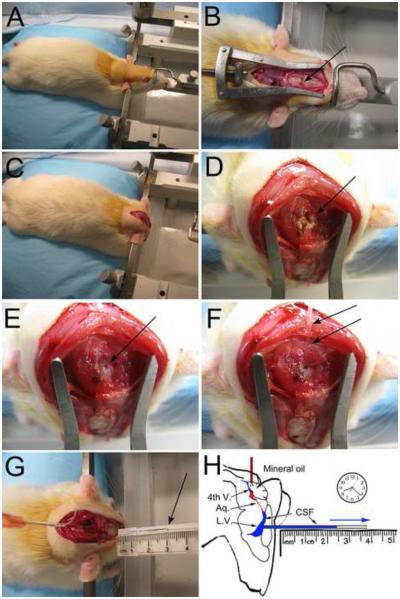
Figure 1. The experimental procedure for measuring CSF formation.
A–H: Photographs (A–G) and artistic depiction (H) of the procedure for measuring CSF formation. An anesthetized rat is mounted in a stereotactic apparatus in the usual manner with an incisor-bar and ear-bars (A); a midline scalp incision is made to expose the skull, and a 1.3-mm burr hole, centered over the left lateral ventricle (x, −0.8 mm; y, +1.7 mm relative to bregma), is made (B, arrow); the hind end of the animal is elevated ~2 cm, the incisor-bar is removed, the rat’s head is rotated on the ear-bars 90°, nose-down, and is held in this vertical position using an improvised plastic device pressing against the dorsum of the snout (C); the suboccipital muscles are bluntly dissected to expose the atlanto-occiptal ligament (D, arrow); the ligament is partially resected and the underlying dura is punctured in the midline (E, arrow); a 23 gauge flexible catheter (PE-20) loaded with sterile, molecular grade mineral oil pre-warmed to 37° C is advanced gently 5 mm through the foramen of Magendie into the 4th ventricle for infusion of mineral oil (100 µl) into the 4th ventricle to occlude the aqueduct of Sylvius (F, arrows); the left lateral ventricle is cannulated using a pre-marked glass capillary tube held horizontally in the correct “x” and “y” planes (now rotated 90°), and is carefully advanced by hand horizontally through the burr hole to a “z” coordinate of 4 mm to enter the frontal horn of the lateral ventricle, allowing CSF to exit (G, arrow); the distance traveled by the advancing front of fluid is used to calculate the rate of CSF formation (H).

