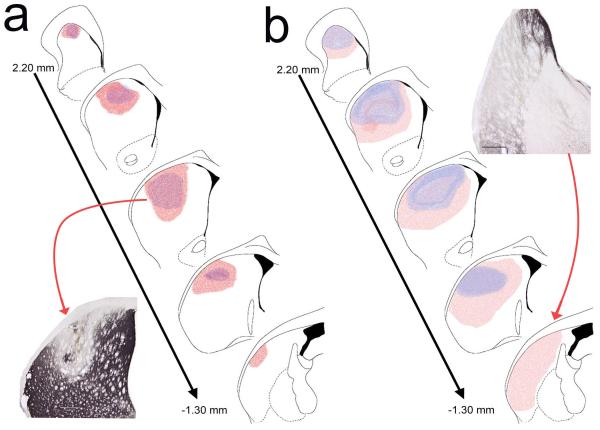
Fig. 3.
Schematic representation of the extent of small (a) and large (b) DA lesions. As detailed in Methods, for small DA lesions 6-OHDA was infused into two sites per hemisphere and for large DA lesions into 4 sites. For each group, the smallest (blue) and the largest (pink) lesion are shown. Note that large DA lesions also extended further into the posterior lateral and ventral striatum (see Results for quantitative analyses).

