Figure 5.
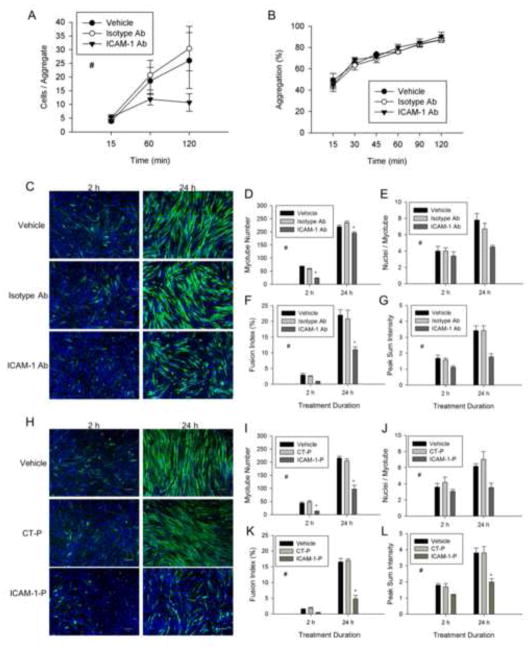
The extracellular and cytoplasmic domains of ICAM-1 in the regulation of myotube formation, myonuclear accretion, and myotube alignment. ICAM-1+ cells were treated with vehicle, isotype control antibody (Isotype Ab; 100 μg/ml), control peptide (CT-P; 100 μg/ml), ICAM-1 antibody (ICAM-1 Ab; 100 μg/ml), or ICAM-1 peptide (ICAM-1-P; 100 μg/ml) at 1 d of differentiation for 2 or 24 h. A) Average number of cells within aggregates of ICAM-1+ cells treated with vehicle, Isotype Ab, or ICAM-1 Ab throughout 120 min of incubation (n=5). # = lower for ICAM-1 Ab compare to vehicle and Isotype-Ab (main effect for treatment; p < 0.05). B) Percent aggregation of ICAM-1+ cells treated with vehicle or antibody throughout 120 min of incubation (n=4). C) Representative images of myosin heavy chain (green) and nuclei (blue) in ICAM-1+ cells after 2 and 24 h treatment with vehicle or antibody (scale bar = 100 μm). Quantitative analysis of myotube number (D), average number of nuclei within myotubes (E), fusion index (F), and peak normalized sum intensity (G) (n=3). # = lower for ICAM-1 Ab compared to Isotype-Ab and vehicle (main effect for treatment; p < 0.05), * = lower for ICAM-1 Ab compared to Isotype-Ab and vehicle at indicated duration of treatment (interaction effect; p < 0.05). H) Representative images of myosin heavy chain (green) and nuclei (blue) in ICAM-1+ cells after 2 and 24 h treatment with vehicle or peptide (scale bar = 100 μm). Quantitative analysis of myotube number (I), average number of nuclei within myotubes (J), fusion index (K), and peak normalized sum intensity (L) (n=4). # = lower for ICAM-1-P compared to CT-P and vehicle (main effect for treatment; p < 0.005), * = lower for ICAM-1-P compared to CT-P and vehicle at indicated duration of treatment (interaction effect; p < 0.05).

