
Fig. 3.
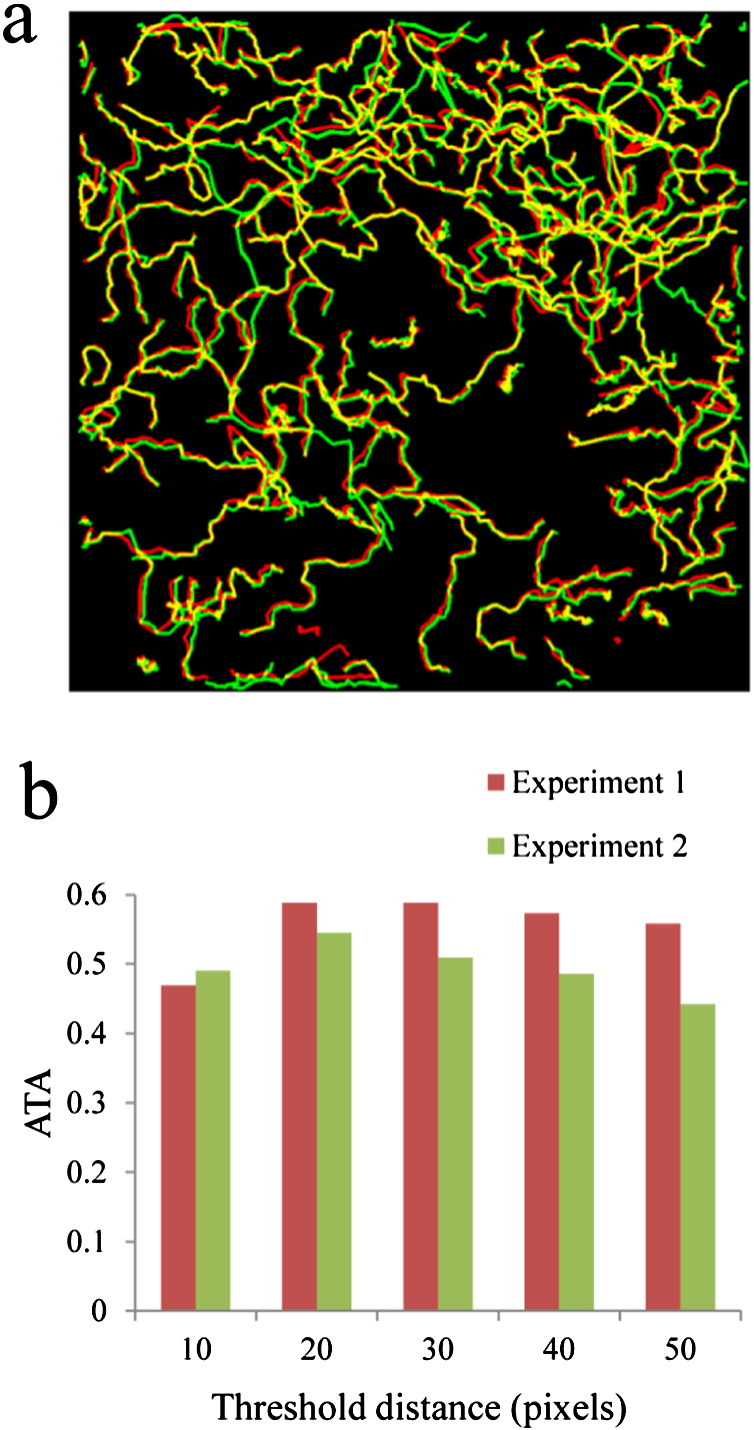
Evaluation of performance of tracking T cells by TIAM. a) Tracks of cells obtained after manually establishing the ground truth (in green) are overlaid on tracks of cells obtained from TIAM (in red). The overlap between the tracks is shown in yellow. These correspond to frames 11–40 of Experiment 2 (Table 1). b) ATA values at different thresholds for the nearest neighbor association (parameter r) in both experiments. ATA values suggest that tracking results are relatively robust to changes in the threshold value for the nearest neighbor association, a critical parameter in the tracking algorithm. Thresholded ATA values are plotted here. Jaccard Similarity of 0.4 or more is considered as 1 (see Supplementary methods) during the calculation of thresholded ATA. This is done to ensure that minor localization inaccuracy is not penalized.