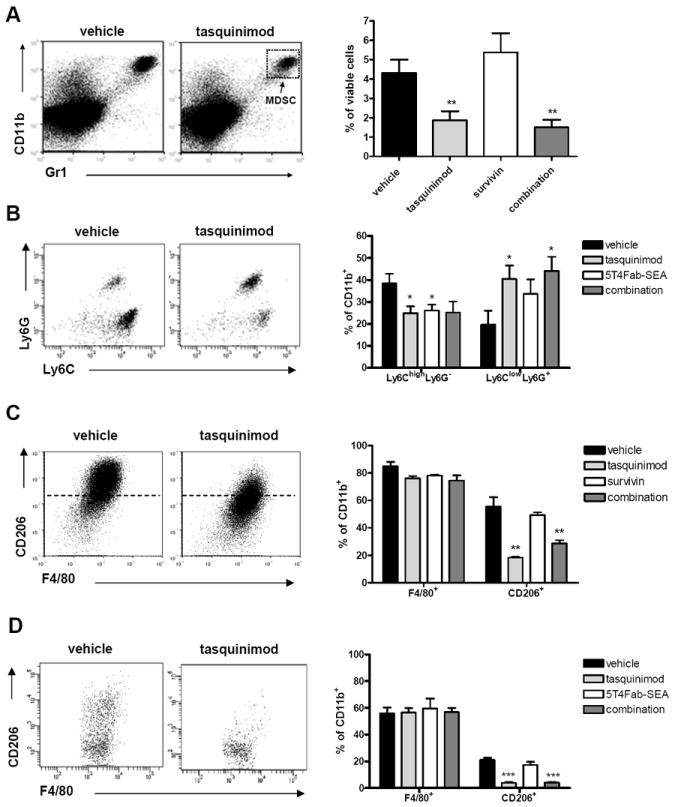
Figure 4. Tasquinimod modulates MDSC populations in the CR Myc-CaP and B16-h5T4 tumor models.

A. FACS analysis of tumor-cell suspensions from the CR Myc-CaP model for CD11b+Gr1+ MDSCs after tasquinimod treatment. B. FACS analysis of tumor-cell suspensions from the B16-h5T4 model for granulocytic Ly6G+Ly6Clow and monocytic Ly6G-Ly6Chigh GR1+ MDSCs. FACS analysis of tumor-cell suspensions for F4/80+ macrophages and for CD206 expression from (C.) CR Myc-CaP tumors; and (D.) B16-5T4 tumors. FACS plots and quantifications are depicted throughout. (*p < 0.05; ** = p<0.01; *** p<0.001, t-test. Error bars indicate s.e.m.)
