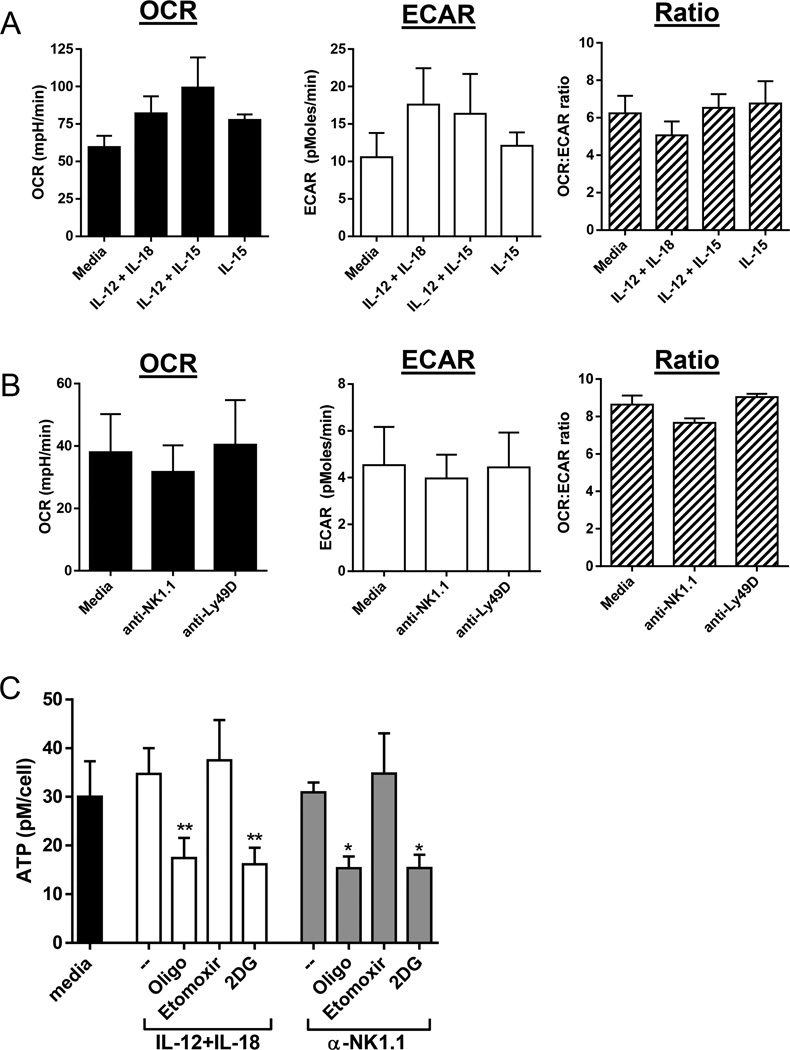
Figure 1. Metabolism of resting and activated NK cells.
Extracellular flux assays were used to measure resting and activated NK cell oxygen consumption rate (OCR), a measure of mitochondrial OXPHOS, and extracellular acidification rate (ECAR), a measure of glycolysis. (A) Cytokine activation (4h) or (B) receptor stimulation (6h) did not significantly change OCR, ECAR or the OCR:ECAR ratio. Results represent the mean +/−SEM of triplicate wells from 3 independent experiments. (C) Intracellular ATP (pM/cell) after 6hr culture of NK cells with cytokines or plate-bound anti-NK1.1 in complete media (--) or with the metabolic inhibitors oligomycin (oligo, 1uM), etomoxir (300µM), and 2DG (50mM). Statistics represent the comparison between stimulation alone versus stimulation with the indicated inhibitor for IL-12+IL-18 or anti-NK1.1 activated NK cells (one-way paired ANOVA). Results represent the mean +/−SEM of triplicate wells from 4 independent experiments. ns, not significant; *p≤0.05; **p≤0.01.

