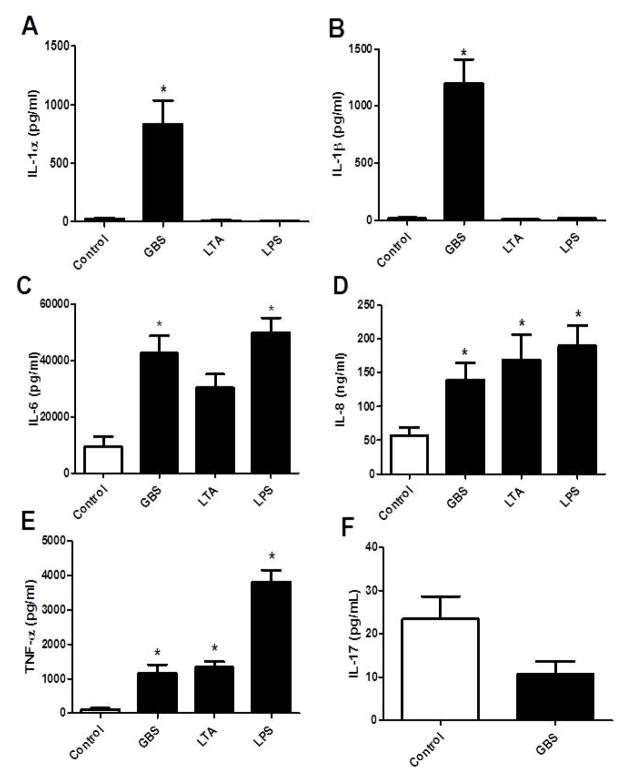
Figure 3.
Cytokine release into medium by choriodecidual punch cultures treated with medium alone (control), live GBS, LTA, or LPS. IL-1α (A), IL-1β (B), IL-6 (C), IL-8 (D), and TNF-α (E) in the medium were measured by ELISA. IL-17 (F) release was measured after treatment with medium alone (control) or live GBS. Columns are mean ± SEM (N=21 women for Control and live GBS treatment groups; N=6 women for LTA and LPS treatment groups). Asterisks (*) represent significant differences between treatment and control when compared by Tukey’s post hoc test following ANOVA (P < 0.05).

