Figure 1.
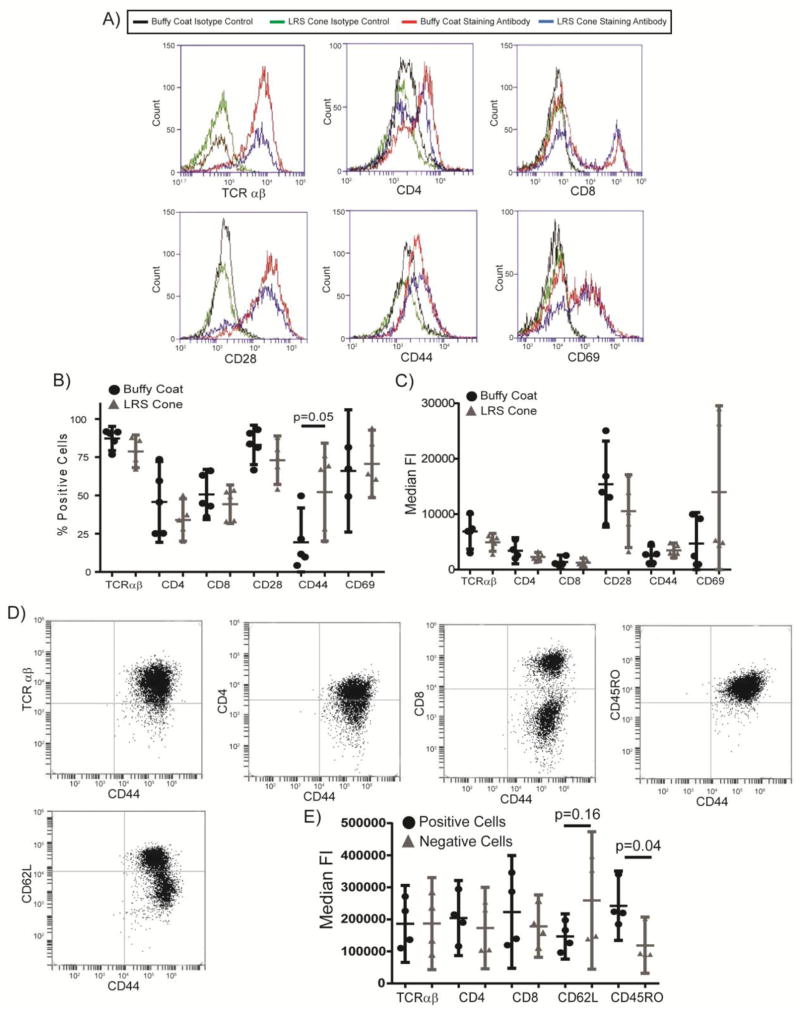
Activated T cells from standard buffy coat isolation and LRS cone isolation have similar surface receptor expression. (A) The expression of surface markers on expanded T cells from the two isolation methods was assessed by flow cytometry. (B) The percentage of cells expressing surface markers was determined by flow cytometry after setting the isotype control stained cells to 4–5% positive. The bar is the average ± the 95% confidence interval for six separate donors for each isolation methods with the outliers removed as described in the Materials and Methods. The p value for significant changes in expression of CD44 is shown. (C) The median fluorescence intensity of live cells was determined by flow cytometry. The results are an average ± 95% confidence intervals for six donors for each isolation method with the outliers removed as described in the Materials and Methods. No significant changes were observed. (D) The co-expression of surface markers on expanded T cells from the LRS cones was assessed by flow cytometry. (E) The median fluorescence intensity of CD44 in live cells that were positive or negative for the indicated surface protein was determined by flow cytometry. The results are an average ± 95% confidence intervals for four donors. The p value for differences in expression of CD44 is shown.

