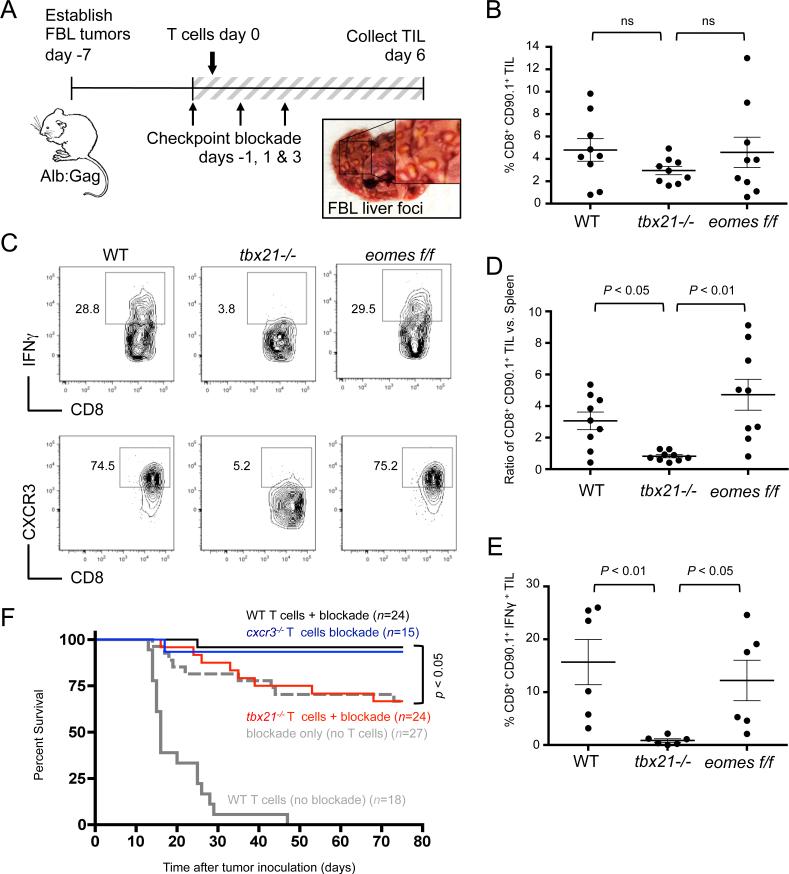
Figure 3. T-bet is required for TIL effector function and immunotherapy but not for tumor infiltration.
FBL tumor-bearing Alb:Gag mice were infused with of WT, tbx21−/−, or eomesf/f Gag-reactive CD8+ T cells and treated on days −1, 1 and 3 with combination checkpoint blockade. (A) Diagram of experimental setup for panels B-E, and example of tumor foci (inset box) on a representative liver at day 6. (B) The frequency of transferred CD90.1+ CD8+ T cells among all TILs was assessed 6 days after T-cell infusion, and data pooled from 3 separate experiments and displayed graphically. (C) IFNγ production by transferred T cells after overnight restimulation with Gag peptide and CXCR3 surface expression directly ex vivo were assessed. (D) The ratio of CD90.1+ CD8+ T-cell frequency in TILs versus in spleens from the same recipients in Fig. 2B is shown. (E) Pooled data from 3 individual experiments showing the frequency of CD90.1+ CD8+ TILs producing IFNγ. Circles within all graphs represent individual recipient mice and horizontal lines show the mean of each group with p-values indicated for the bracketed groups; all error bars represent SEM. (F) Survival of tumor-bearing Alb:Gag recipients was assessed following treatment with WT T cells only (gray line), checkpoint blockade (anti-CTLA-4/PD-1/LAG-3) only (dashed gray line), or checkpoint blockade and adoptive transfer of WT T cells (black line), cxcr3−/− T cells (blue) or tbx21−/− T cells (red). The graph displays pooled data from 5 independent experiments, showing percent survival (y-axis) over time in days (x-axis). The n-values depict the number of total mice per treatment group and the p-value is indicated for the bracketed groups.

