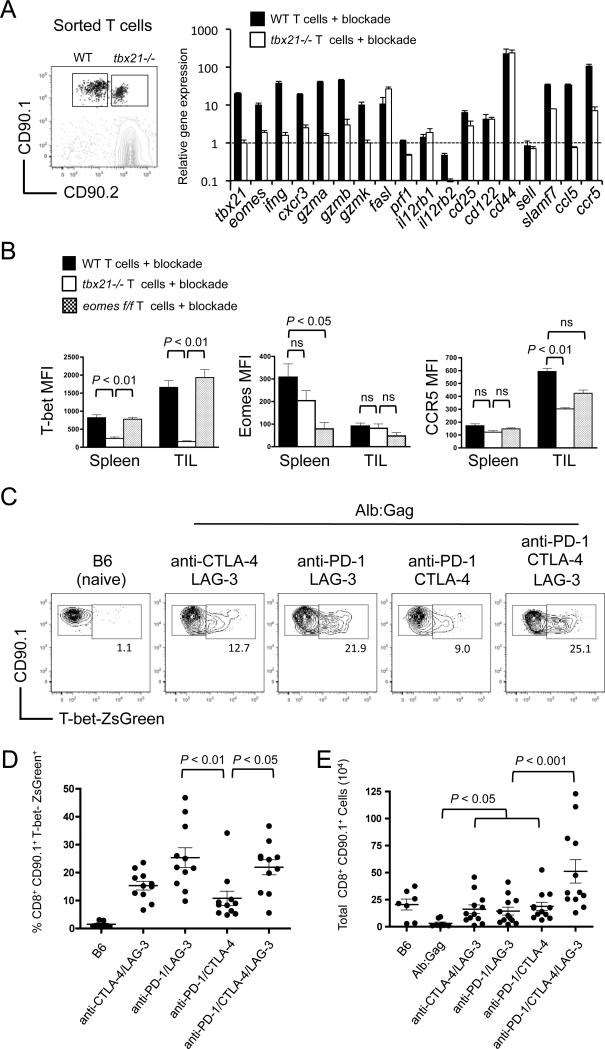
Figure 4. T-bet regulates expression of T-cell effector genes.
FBL tumor-bearing Alb:Gag mice received a co-transfer of WT (CD90.1) and tbx21−/− (CD90.1/CD90.2) Gag-reactive CD8+ T cells and were treated with combination checkpoint blockade on days −1, 1 and 3. (A) Six days after T-cell infusion, transferred T cells were isolated from the spleen and RNA isolated for analysis by qRT-PCR. Expression of the indicated genes from WT (closed bars) and tbx21−/− (open bars) T cells is shown relative to the level of the same gene expressed in naive Gag-reactive CD8+ T cells, which was arbitrarily set at a value of 1 and indicated by the dashed horizontal line. Results are representative of 2 independent experiments, and error bars represent SD among triplicate samples. (B) MFI of T-bet, Eomes, and CCR5 from WT (closed bars), tbx21−/− (open bars) and eomesf/f (shaded bars) Gag-reactive CD8+ T cells from spleens and TILs 6 days after infusion into FBL tumor-bearing Alb:Gag mice treated with checkpoint blockade. Graphs displays data from 2 pooled experiments and error bars indicate SEM with p-values indicated for the bracketed groups. (C) B6 or FBL tumor-bearing Alb:Gag mice were infused with T-bet-ZsGreen Gag-reactive CD8+ T cells and treated with checkpoint blockade antibodies on days −1, 1, and 3. Representative FACS plots display T-bet-ZsGreen expression on splenic CD8+ CD90.1+ cells 6 days after transfer. Inset numbers are the frequency of cells within the above region. (D) Pooled data from 4 independent experiments shows the frequency of CD8+ CD90.1+ T-bet-ZsGreen+ cells from indicated recipient mice. (E) Total CD8+ CD90.1+ T-bet-ZsGreen+ cell numbers pooled from 4 separate experiments are displayed graphically. Each circle represents an individual mouse and p-values are indicated for the bracketed groups.

