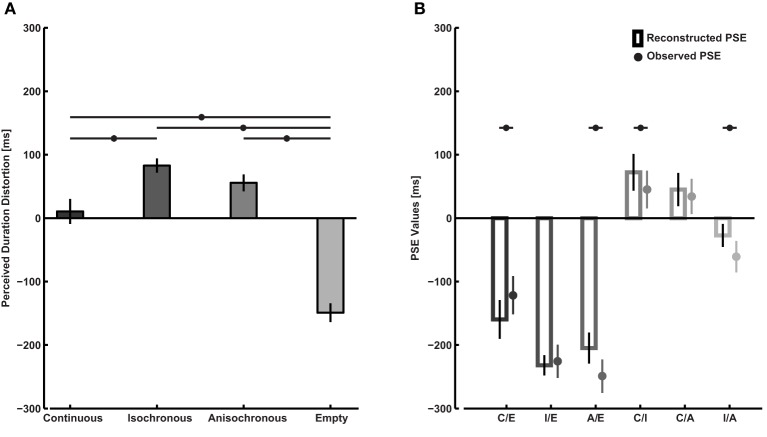
Figure 3.
Analysis of perceived duration distortions obtained from empirical PSE values. (A) Perceived duration distortions relative to the mean of all intervals tested (the zero point on the vertical axis corresponds to the average distortion across the interval types tested) calculated from the empirical PSE values according to the system of equations described in the text. Asterisks represent a significant difference in distortion between two interval types as indicated by the horizontal lines. (B) Empirical PSE values compared to reconstructed PSE values from the calculated perceived duration distortions. Asterisks indicate a significant difference between the two, suggesting that factors other than duration distortion of the two intervals to be compared might have affected participant's judgments.

