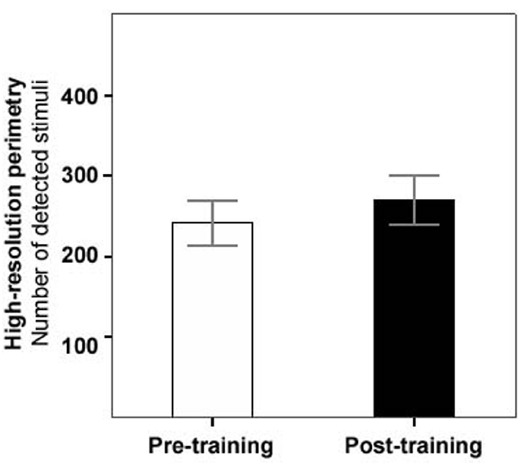
FIGURE 1.

Increase of light detection performance before vs. after training. Mean number of detected stimuli (out of 474) in computer-based high-resolution perimetry before (white bar) and after training (black bar), across the patient group (error bars represent SEM).
