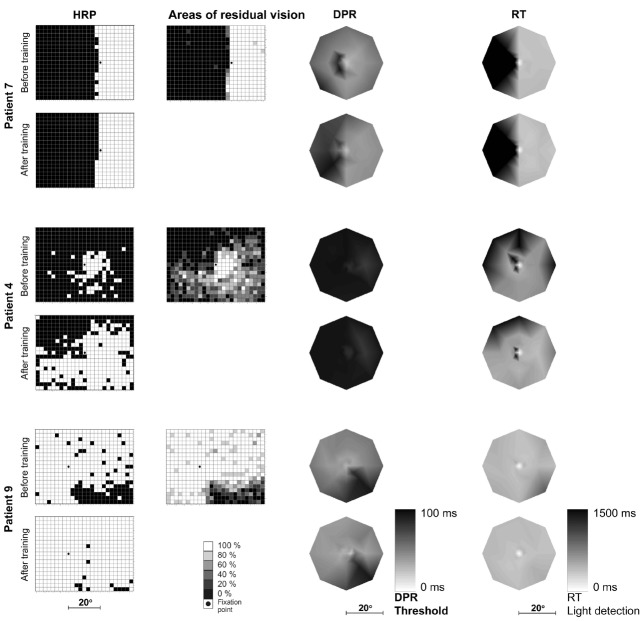
FIGURE 2.
Topography of light detection, DPR, and RTs before and after training. Typical examples of three patients with different magnitudes of change: no improvement (patient 7; first two rows), intermediate success (patient 4; middle two rows), and strong recovery (patient 9; bottom two rows) over 3 months of vision restoration training. For each patient, light detection performance in high-resolution perimetry (HRP; leftmost column) is shown before and after training. Black: blind field, white: intact field. The second column shows areas of residual vision (or transition zones) before training: shades of gray represent the probability of stimulus detection at each location. Double-pulse resolution (DPR) thresholds (third column) are plotted for the inner 20° radius of the visual field, before and after training (lighter areas represent better temporal resolution, i.e., lower thresholds). RTs in response to simple light stimuli in HRP before and after training (right column) are shown for the same visual field positions as for DPR measurements (lighter areas represent faster responses). Note that DPR and RT plots are shown in central fixation perspective while the visual field (detection) maps in the first two columns show the fixation position on the screen as presented in the original test.

