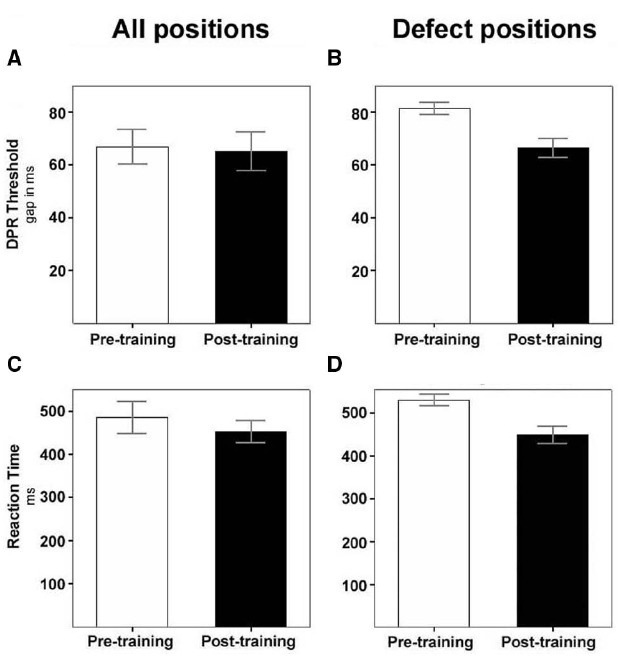
FIGURE 3.

Decrease of DPR thresholds and of RTs over training. White bars, before training; black bars, after training. (A) Mean DPR thresholds (±SEM) of the total patient sample for all visual field positions, including intact areas; (B) mean DPR thresholds (±SEM) of the total patient sample for positions in the defective field only. (C) Mean RTs (±SEM) of the total patient sample for all visual field positions, including intact areas; (D) mean RTs (±SEM) of the total patient sample for positions in the defective field only.
